


 108 / 168

108
CORPORATE SOCIAL RESPONSIBILITY
6
LISI 2017 FINANCIAL REPORT
3.5.2
|
Environment
3.5.2.1 Water consumption
In 2017, LISI consumed 866,303 m
3
of water. To link it to production,
LISI looks at the ratio of consumption to added value. Thus between
2016 and 2017, this ratio declined by 13%, from 1.074 MWh/€k (AV) to
1.231 MWh/€k (AV).
Water is mainly consumed at two of the Group’s production
sites (Bologne and La Ferté Fresnel/Dreux) for the cooling of the
process. These two sites also account for 52% of the Group’s total
consumption. Although this water is primarily returned to the natural
environment, works carried out, such as the repair of leakages on
ageing underground pipes, have led to a savings of 50,147 m
3
(5.5%).
Furthermore, the Forge 2020 project aims at relocating the activities
of the Bologne site a few kilometers away from its historical
location, in new premises which are more suitable for our activities.
Environmental aspects are fully taken into account in this project in
order to reduce impacts inherent to our processes. Hence, as regards
water consumption, it is planned to recycle rain water and to have less
water-intensive surface treatment systems.
3.5.2.2 Energy consumption
The energy consumption of the LISI Group is 492,065 MWh in 2017.
It is strongly linked with the business but also with weather conditions.
However, to take on board the impacts of the production activity,
LISI monitors the ratio of consumption to added value. Thus between
2016 and 2017, this ratio declined by 4%, from 0.636 MWh/€k (AV) to
0.610 MWh/€k (AV).
Energy is mainly consumed at production sites which have a heat
treatment process, in particular Bologne, but also at Marmande, Delle,
Bars/ Aube, Kierspe and Torrance.
These six sites also account for 44% of the Group’s total consumption.
The Bologne site has the highest energy consumption, all forms of
energy taken together, with 13% of the Group’s total energy. The Forge
2020 project will reduce this consumption through better insulation
of the building, recovery of energy used in the process to heat the
buildings and the installation of LED for the lighting of workshops and
offices. The results are expected in 2021.
3.5.2.3 Waste production
In 2017, waste production was 56.1 kg of waste for €1,000 of added
value, or a decline of 3% compared with 2016.
Moreover, the share of sorted waste is still high at 95.7%, a stable
percentage compared with 2016. The remaining portion concerns
domestic waste generated by production-related activities (toilets,
cafeterias, etc.).
The production plants principally generate metallic waste (53% of
the total quantity of waste produced). These are sold for recycling.
Dangerous waste sorted, which represents 32% of the total quantity
of waste, is removed via authorized channels that abide strictly by
applicable regulations.
Metal, plastic, wood/paper/cardboard and oil waste are either
recycled or used to produce energy.
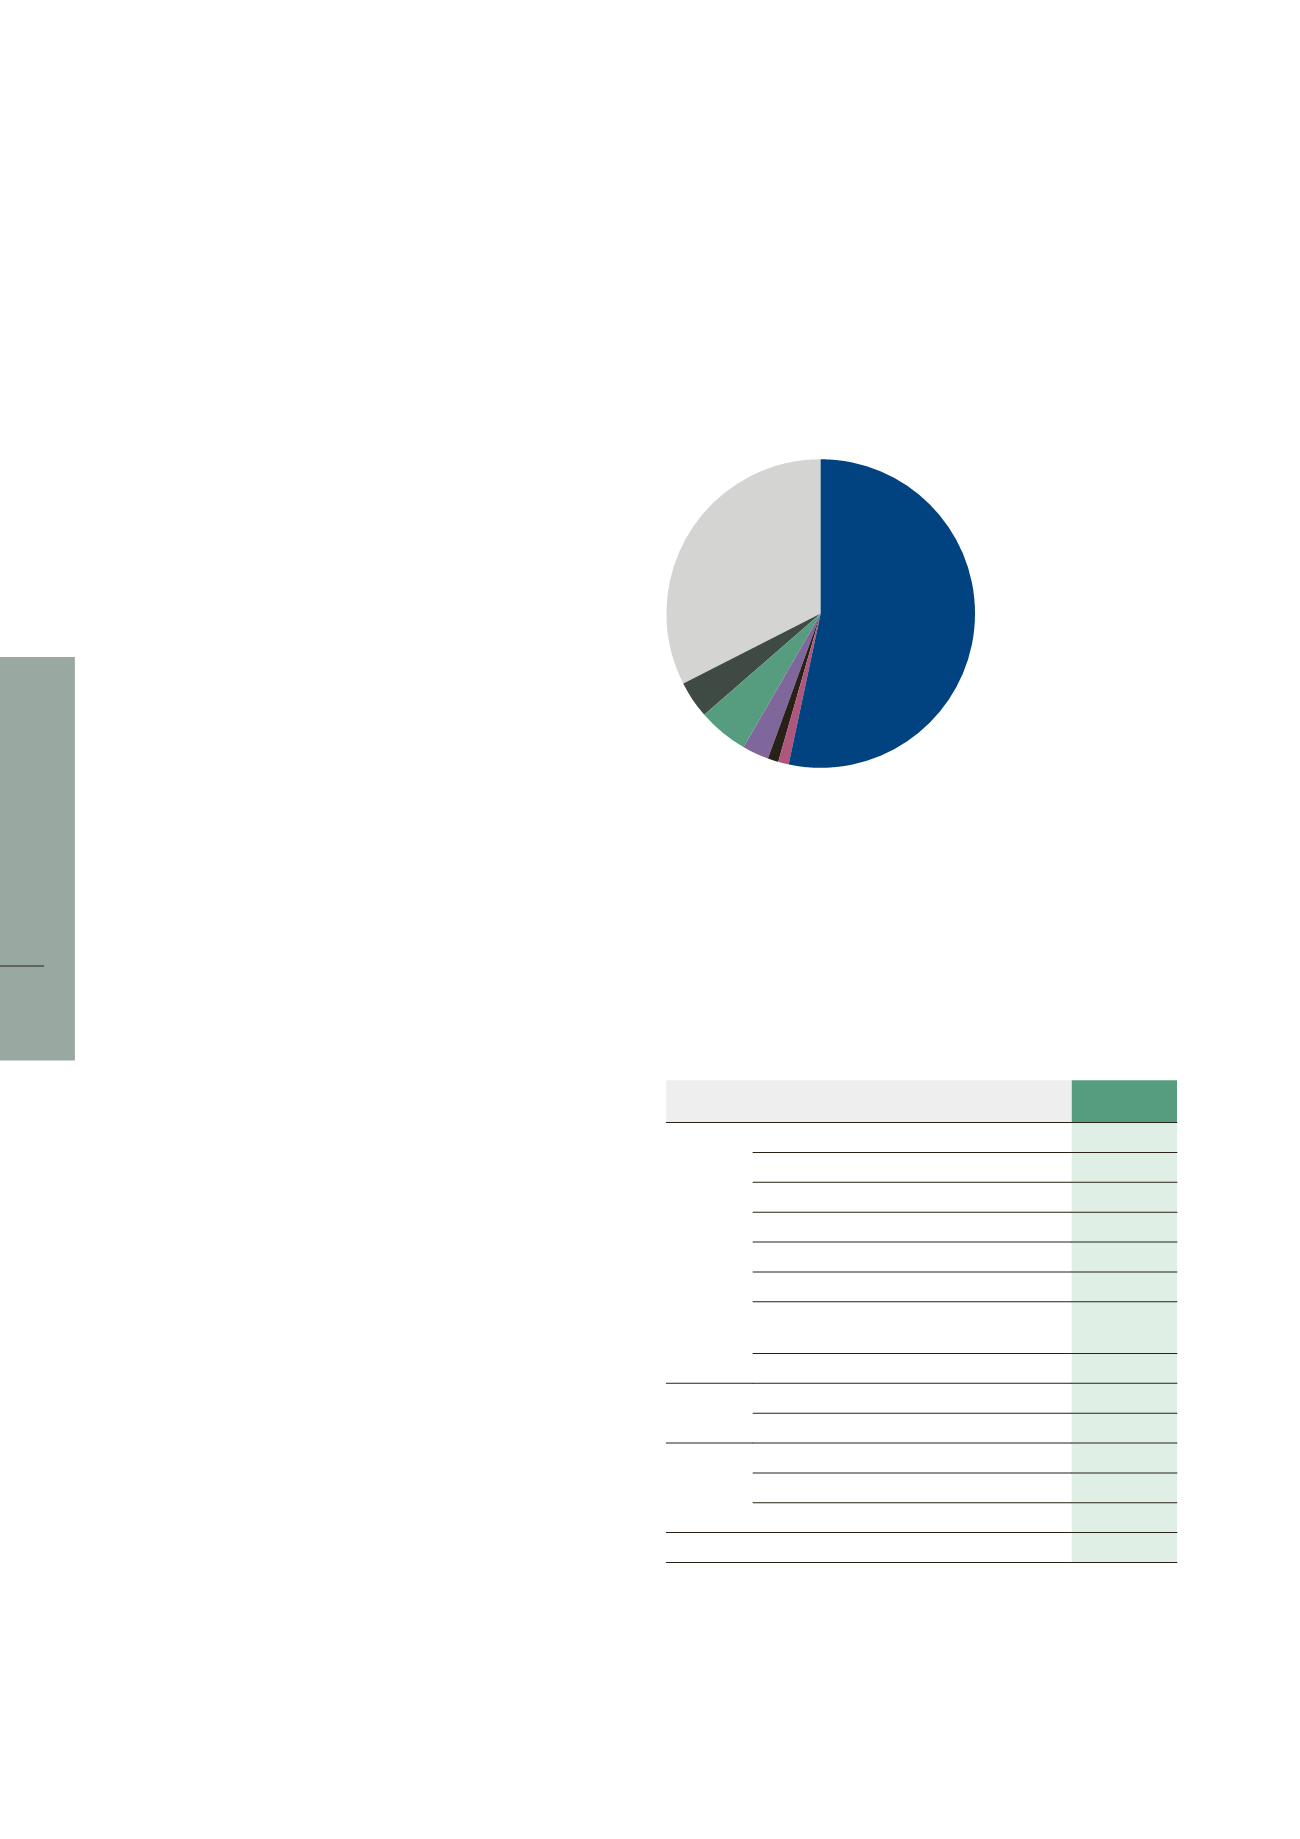
In 2017, the proportion of recyclable waste stood at 63.1% or the same
level of 2016. The remaining portion is made up of hazardous waste
and household waste.
■
53% SortedMetal
■
1% Paper-sorted
cardboard
■
1% Sortedplastic
■
3% Sortedwood
■
5% Sortedoil
■
4% Otherhousehold
waste (non-hazardous)
ornon-sorted
householdwaste
■
32% Hazardouswastes
3.5.2.4 Greenhouse Gas (GHG)
Duringtheyear2017,LISIundertookanAssessmentoftheGreenhouse
Gas (GHG) generated by its activities for Scopes 1, 2, and 3.
The main activities generating greenhouse gas (GHG) are the
consumption of raw materials, the consumption of energy, the use
of refrigeration units and air-conditioners and the movement of
people and goods. All activities of LISI taken together generated
515,252 tons of CO
2
.
Their breakdown is the following:
Scope
Indicators
2017
Scope 1
GHG Natural Gas [kg GHG]
40,813,838
GHG Domestic heating fuel [kg GHG]
58
GHG Heating network [kg GHG]
–
GES LPG [kg GHG]
1,726,242
GHG Vehicles owned [kg GHG]
731,746
GHG Private vehicles under lease [kg GHG]
2,154
GHG Fugitive emissions from refrigerants
[kg GHG]
1,195,156
Total GHG Scope 1 [kg GHG]
44,469,194
Scope 2 GHG Electricity [kg GHG]
72,303,279
Total GHG Scope 2 [kg GHG]
72,303,279
Scope 3 Transport to/from (2016 data) [kg GHG]
12,890,640
Consumption of rawmaterials [kg GHG]
385,589,180
Total GHG Scope 3 [kg GHG]
398,479,820
TOTAL TOTAL GHG [kg GHG]
515,252,293