


 113 / 168

113
CORPORATE SOCIAL RESPONSIBILITY
6
LISI 2017 FINANCIAL REPORT
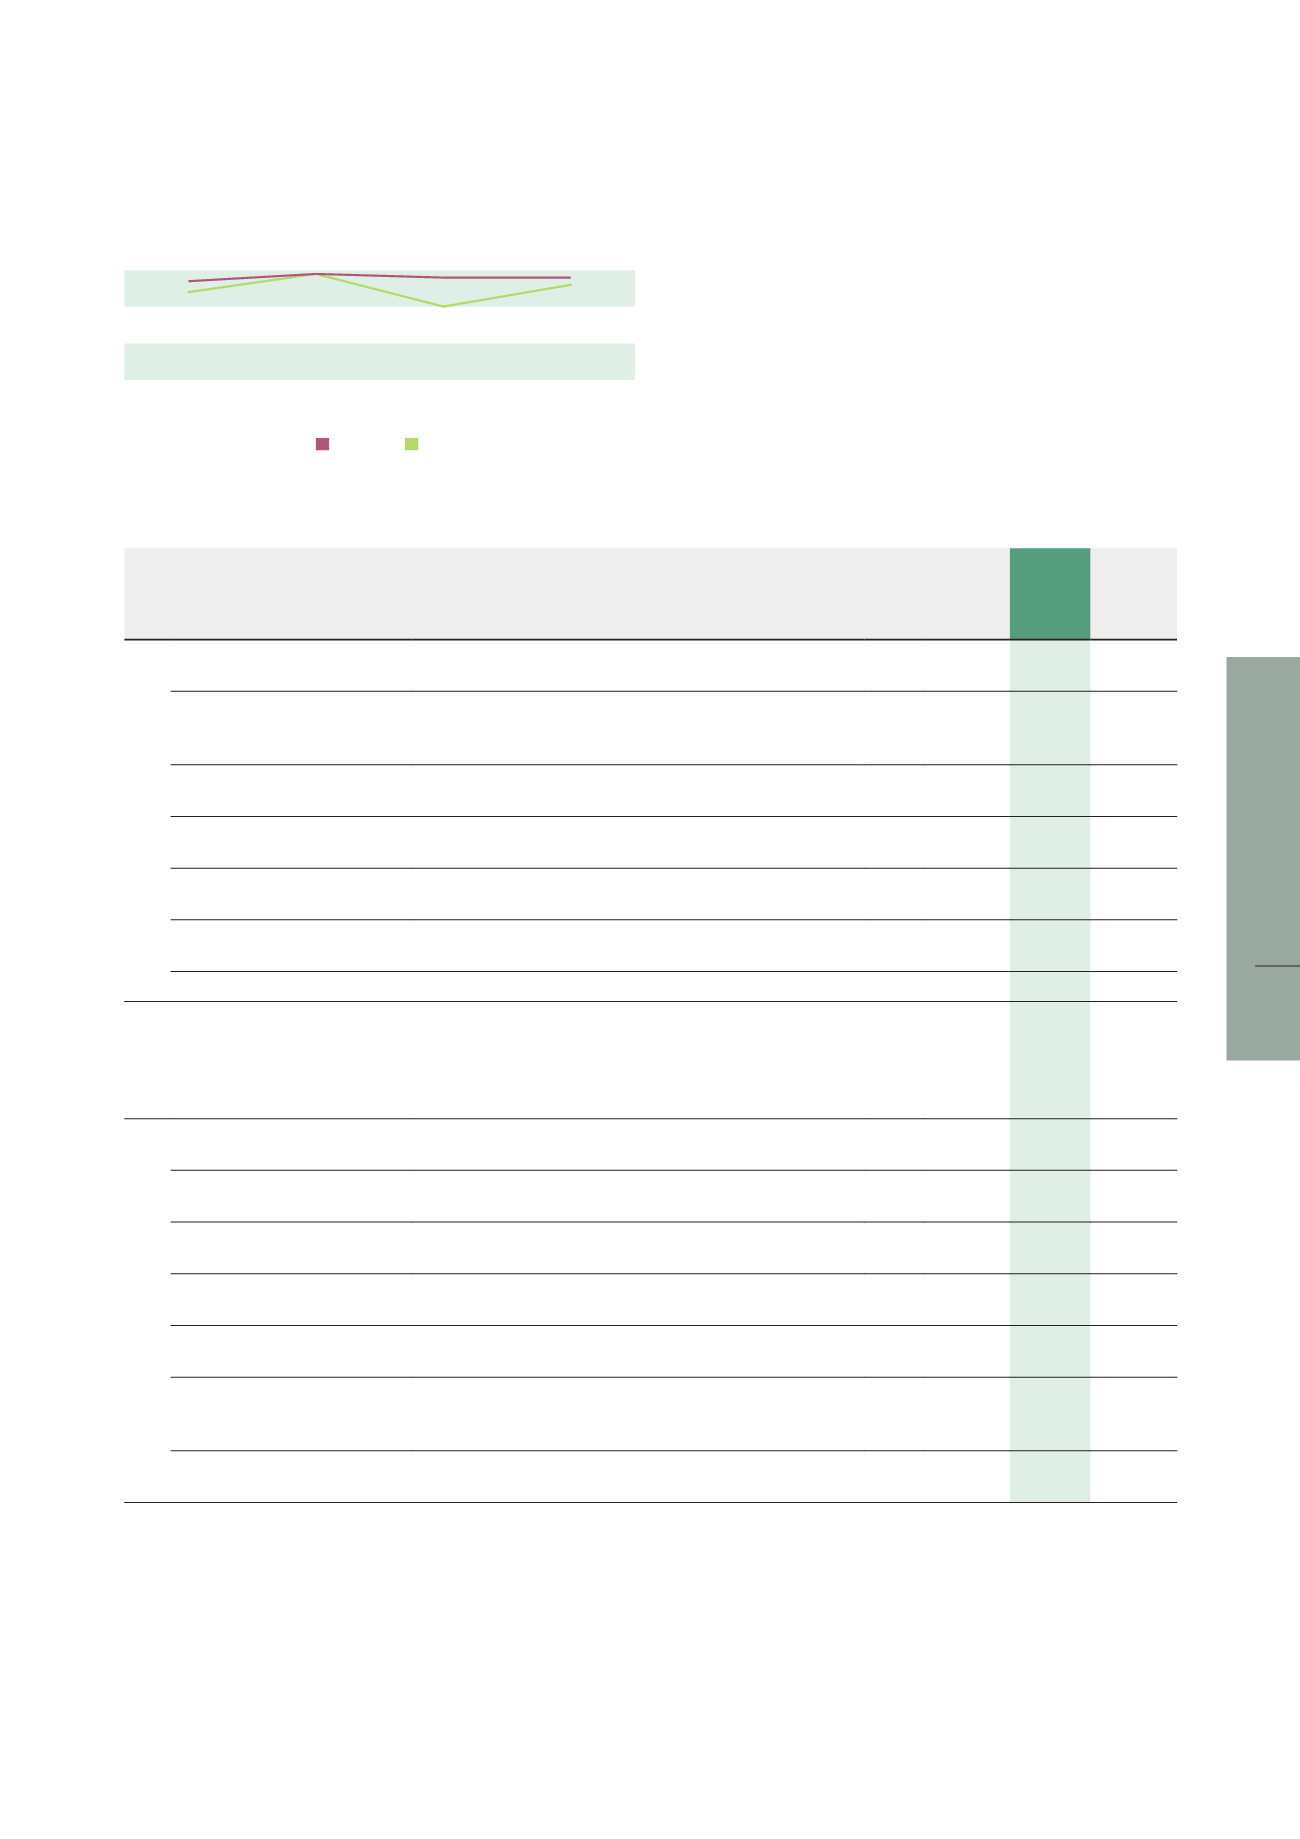
Decline in absenteeism rate in 2017 compared with 2016
2016
2017
TOTAL
LISI
AEROSPACE
LISI
AUTOMOTIVE
LISI
MEDICAL
3.8
3.5
3.7
3.4
3.9
3.9
3.8
3.0
Table of Health Safety Environment indicators
INDICATORS
(January 1 to December 31)
Definition
Unit
2016
2017
Difference
2017
vs. 2016
Energy
Municipal water
Volume of water from the city's distribution network consumed
by the consumption production site
m³
435,079
517,600
82,521
Consumption of water drawn
directly from the natural
environment
Volume of water drawn by the production site from the rivers,
lakes and groundwater
m³
481,371
348,703
-132,668
Electricity consumption
Electrical power from the city grid or self-generated, consumed
by the production site
MWh 292,421
310,339
17,918
Natural gas consumption
Heat energy from the volume of natural gas consumed
by the production site
MWh 172,555
172,652
97
Liquefied petroleum gas
(butane - propane) consumption
Heat energy from the volume of LPG consumed by
the production site
kWh 5,717,292 6,716,896
999,604
Domestic fuel consumption
Volume of heating oil consumed by the production site
for industrial and heating purposes
m³
195
181
-14
Consumption of other energies Other energies (steam, etc.)
kWh 578,407
558,080
-20,327
Hazardous
products
Consumption of products with
permanent harmful effects for
humans
Quantity consumed of all products belonging to the list of
products with harmful and permanent effects for humans
(all products classified as carcinogenic, mutagenic or toxic
for reproduction as defined by local national regulations).
Oil for forklifts can be found in this category
kg 234,437
272,454
38,017
Wastes
Sorted metal
Total amount of metal discharged and sorted as waste according
to national regulations
T 23,090
24,060
971
Paper - Sorted cardboard
Total amount of paper and cardboard discharged and sorted as
waste according to national regulations
T
522
609
87
Sorted plastic
Total amount of plastic discharged and sorted as waste
according to national regulations
T
211
284
73
Sorted wood
Total amount of wood discharged and sorted as waste according
to national regulations
T
1,145
1,215
70
Oil (soluble + whole + whole and
water)
Total amount of oil discharged and sorted as waste according
to national regulations
T
2,076
2,398
322
Other household waste
(non-hazardous) or non-sorted
household waste
Amount of unsorted non-hazardous waste or household waste
(as per national regulations) discharged from the site
T
1,846
2,024
178
Hazardous wastes (without oil)
Amount of hazardous waste (as per national regulations)
excluding oil waste discharged from the site
T 13,778
14,649
871