


 54 / 158

54
LISI 2016 FINANCIAL REPORT
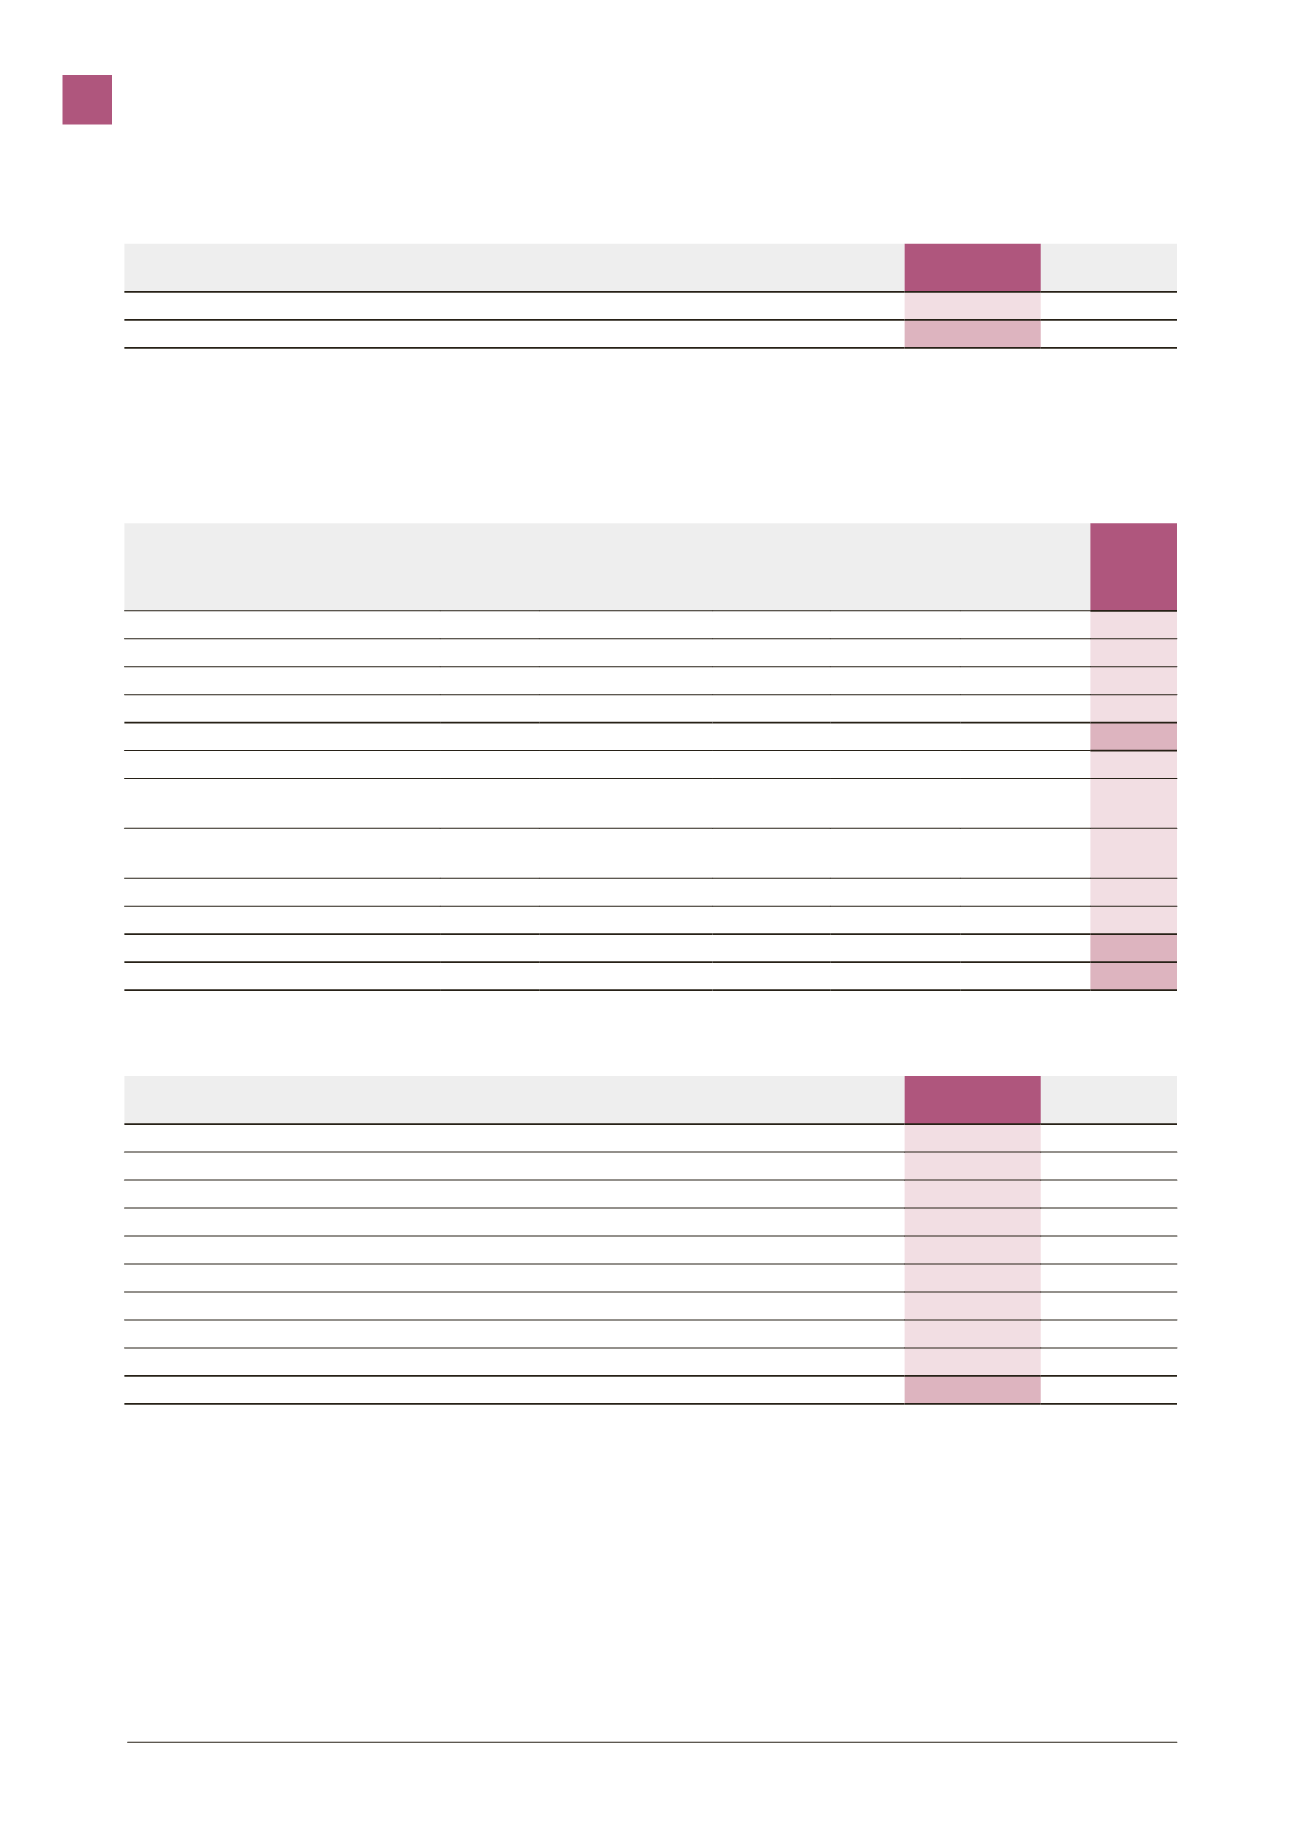
2.5.1.5 Other non-current assets
(in €’000)
12/31/2016
12/31/2015
Other debtors
950
924
TOTAL OTHER NON-CURRENT FINANCIAL ASSETS
950
924
The debt on the balance sheet at December 31, 2016 primarily covers a non-current maturity tax asset.
2.5.2
I
Current assets
2.5.2.1 Inventories
(in €’000)
Raw
materials
Tools and other
procurements
Work in
progress
Finished and
intermediary
products
Goods
TOTAL
Gross values at December 31, 2015
63,436
15,687
160,914
127,132
11,879 379,047
Exchange rate differences
158
(48)
232
42
27
411
Changes in inventory
(567)
755
(4,306)
245
(1,419)
(5,292)
Reclassifications
24
(82)
146
26
0
114
GROSS VALUES AT DECEMBER 31, 2016
65,692
16,344
161,859
131,855
10,487 386,235
Impairment at December 31, 2015
12,095
1,776
7,019
19,782
2,249 42,921
Provisions for amortization
and depreciation
2,450
378
3,267
9,083
537 15,715
Reversal of provisions for amortization
and depreciation
(3,720)
(258)
(3,841)
(5,382)
(365)
(13,566)
Exchange rate differences
75
1
(15)
(214)
91
(62)
Reclassifications
626
0
13
63
0
702
IMPAIRMENT AT DECEMBER 31, 2016
11,617
1,897
7,002
24,225
2,512 47,253
NET VALUES AT DECEMBER 31, 2016
54,075
14,447
154,857
107,630
7,975 338,986
2.5.2.2 Trade and other receivables
(in €’000)
12/31/2016
12/31/2015
Gross debtors and apportioned accounts
226,235
178,480
Impairment of trade and other apportioned accounts
(3,708)
(4,470)
Net debtors and apportioned accounts
222,527
174,010
State - Other taxes and duties
24,516
27,775
Social entities & workforce services
469
1,101
Accounts payable - advances, debtors
3,594
2,857
Deferred charges
4,161
4,174
Other
5,149
5,373
Other receivables
37,889
41,281
TOTAL TRADE AND OTHER RECEIVABLES
260,416
215,291
Assignments of receivables amounted, at December 31, 2016, to
€57.7 million, compared with €67.5 million at December 31, 2015. The
fair value of these transferred assets in accordance with the IFRS 7
definition is equal to their nominal value. These transfers are made in
the form of factoring with conventional subrogation, without recourse,
thereby removing any exposure to a risk of financial loss. There are
five contracts for the sale of receivables, three signed for an indefinite
period, the other two for a term of one year renewable automatically.
These contracts provide for the opportunity to transfer receivables up
to an amount of €112 million.
Overdue receivables not covered by provisions mainly concern major
customers with which the Group has annual or pluriannual business
agreements. On the basis of historic observations, the Company
considers the risk of non-collection marginal, with non-hedged
overdue receivables being mainly within less than one year; the share
within more than one year being totally immaterial.
2.5.2.3 Cash and cash equivalents
The cash available as at December 31, 2016 stood at €141.7 million.
This item consists mainly of investment securities held by the Group
CONSOLIDATED FINANCIAL STATEMENTS
3