


 51 / 158

LISI 2016 FINANCIAL REPORT
51
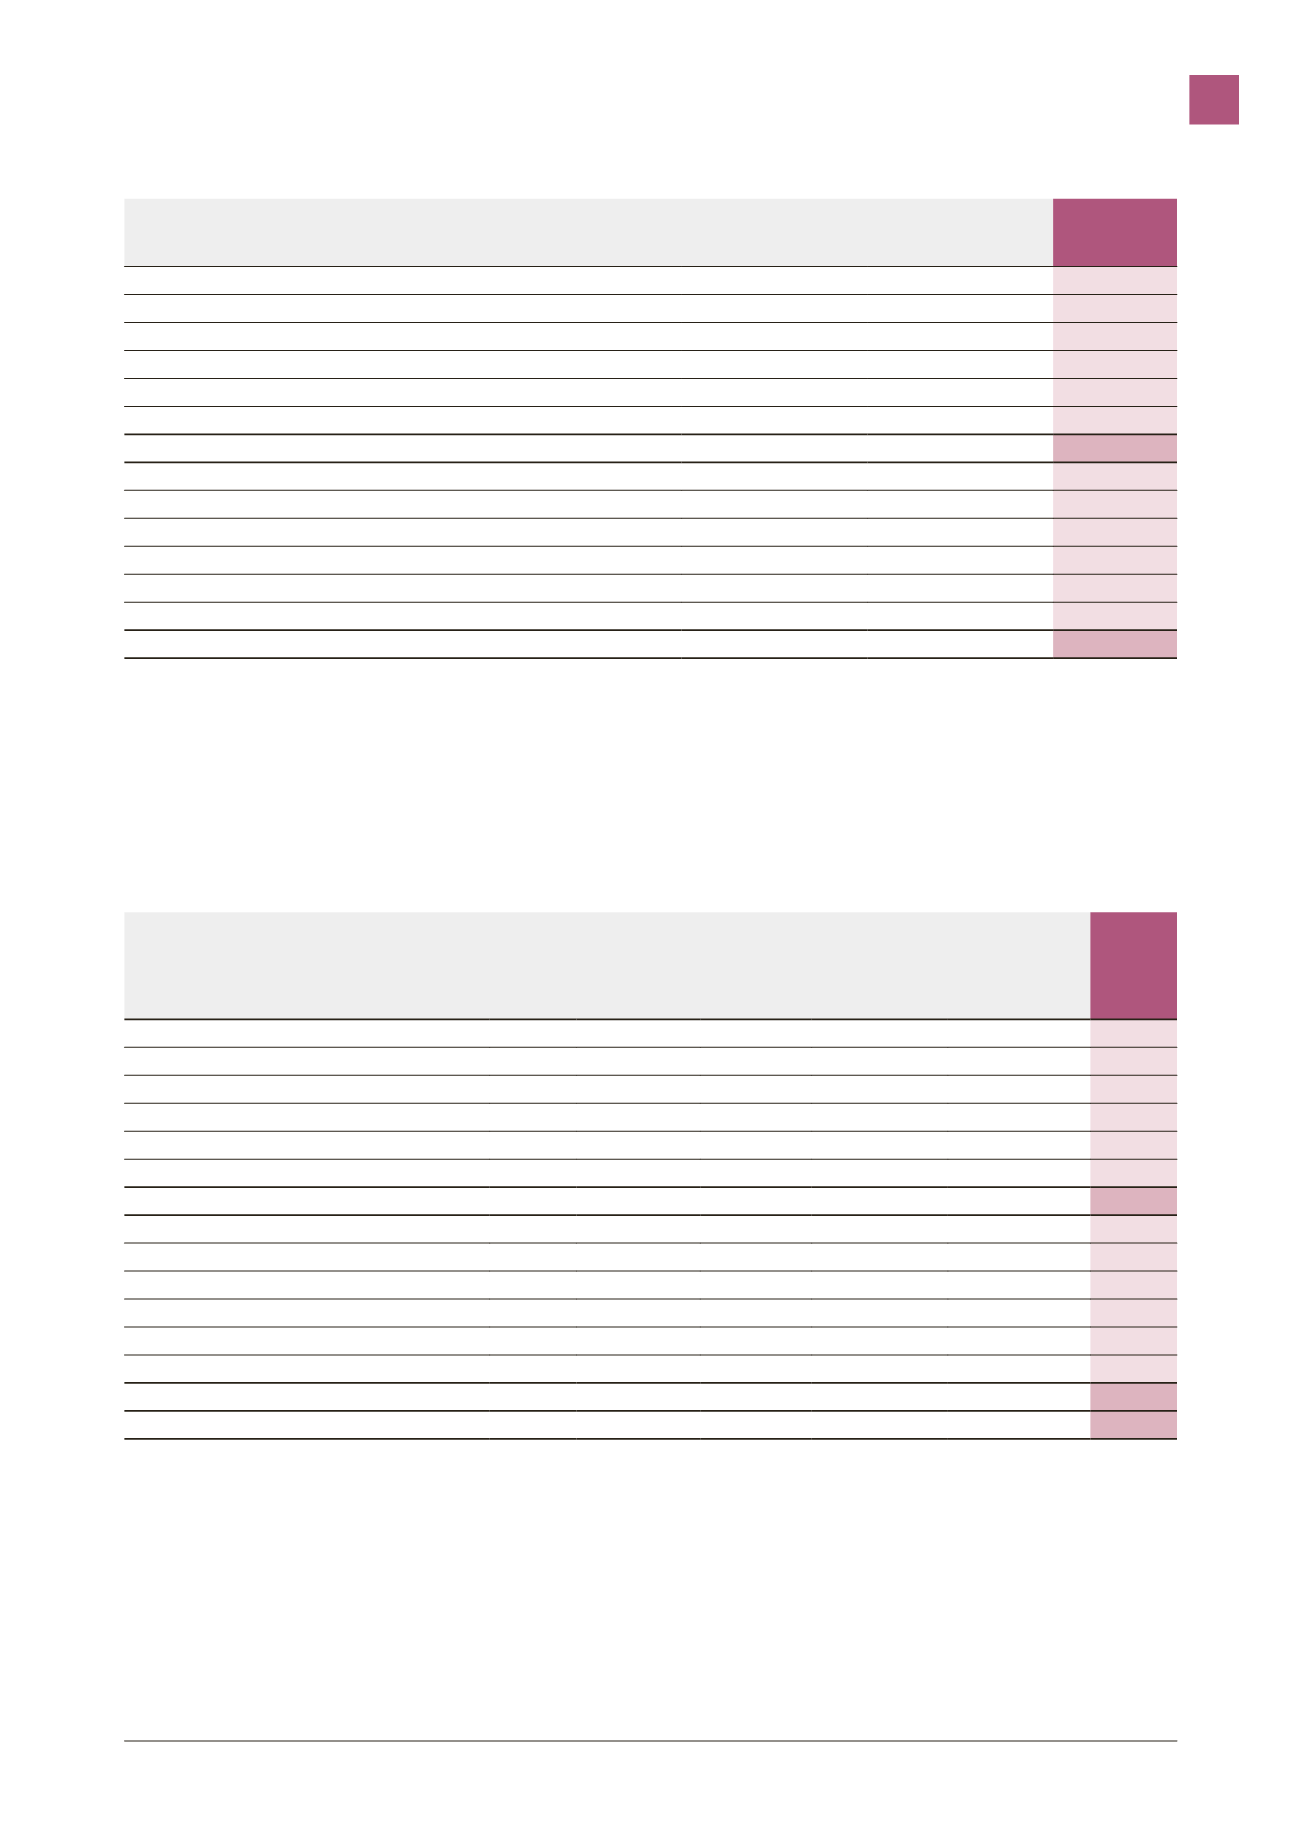
(in €’000)
Concessions, patents
and similar rights
Other intangible
fixed assets *
TOTAL
Gross values at December 31, 2015
58,703
19,490
78,193
Other net changes
547
(553)
(6)
Acquisitions
2,389
5,343
7,732
Disposals
(147)
0
(147)
Scope changes
0
5,510
5,510
Exchange rate differences
(4)
198
194
GROSS VALUES AT DECEMBER 31, 2016
61,488
29,988
91,476
Depreciation at December 31, 2015
49,790
13,478
63,268
Depreciation allowance
4,080
2,424
6,504
Depreciation reversals
(141)
(2,037)
(2,178)
Scope changes
0
47
47
Exchange rate differences
(5)
15
10
Depreciation at December 31, 2015
53,724
13,927
67,651
NET VALUES AT DECEMBER 31, 2016
7,764
16,061
23,822
* Including the Rapid brand
The Rapid brand was valued when the company was acquired in
August 2000 at its fair value of €8.3 million, based on an independent
valuation. Since 2003, it has been decided to amortize it over a period
of 15 years, given the commercial usage period envisaged to date.
The amounts given as scope changes are explained by the entry of
LISI Medical Remmele into the consolidation scope of the Group on
May 1 2016.
2.5.1.2 Tangible assets
a) Tangible assets held in full (including evaluation spreads)
(in €’000)
Land
Buildings
Technical
facilities,
equipment
and tools
Other tangible
assets
Current
assets
TOTAL
Gross values at December 31, 2015
18,510
165,671
892,792
98,370
47,446 1,222,791
Other net changes
27
10,065
45,856
(41)
(56,137)
(230)
Acquisitions
383
21,777
43,471
7,621
51,323 124,575
Disposals
(54)
(924)
(10,635)
(6,526)
(85)
(18,224)
Scope changes
1,300
10,212
27,704
213
4,299 43,728
Exchange rate differences
50
1,149
2,059
119
217
3,595
GROSS VALUES AT DECEMBER 31, 2016
20,216
207,950 1,001,247
99,756
47,064 1,376,237
Depreciation at December 31, 2015
882
71,829
616,347
64,646
176 753,880
Other net changes
0
3,065
(5,178)
(393)
0 (2,506)
Depreciation allowance
91
8,666
58,867
5,257
43 72,924
Depreciation reversals
(269)
(1,180)
(8,987)
(6,355)
0 (16,791)
Scope changes
0
94
2,240
68
0
2,402
Exchange rate differences
0
321
761
57
(1)
1,138
DEPRECIATION AT DECEMBER 31, 2016
704
82,795
664,050
63,280
218 811,047
NET VALUES AT DECEMBER 31, 2016
19,512
125,155
337,198
36,477
46,847 565,188
CONSOLIDATED FINANCIAL STATEMENTS
3