


 53 / 158

LISI 2016 FINANCIAL REPORT
53
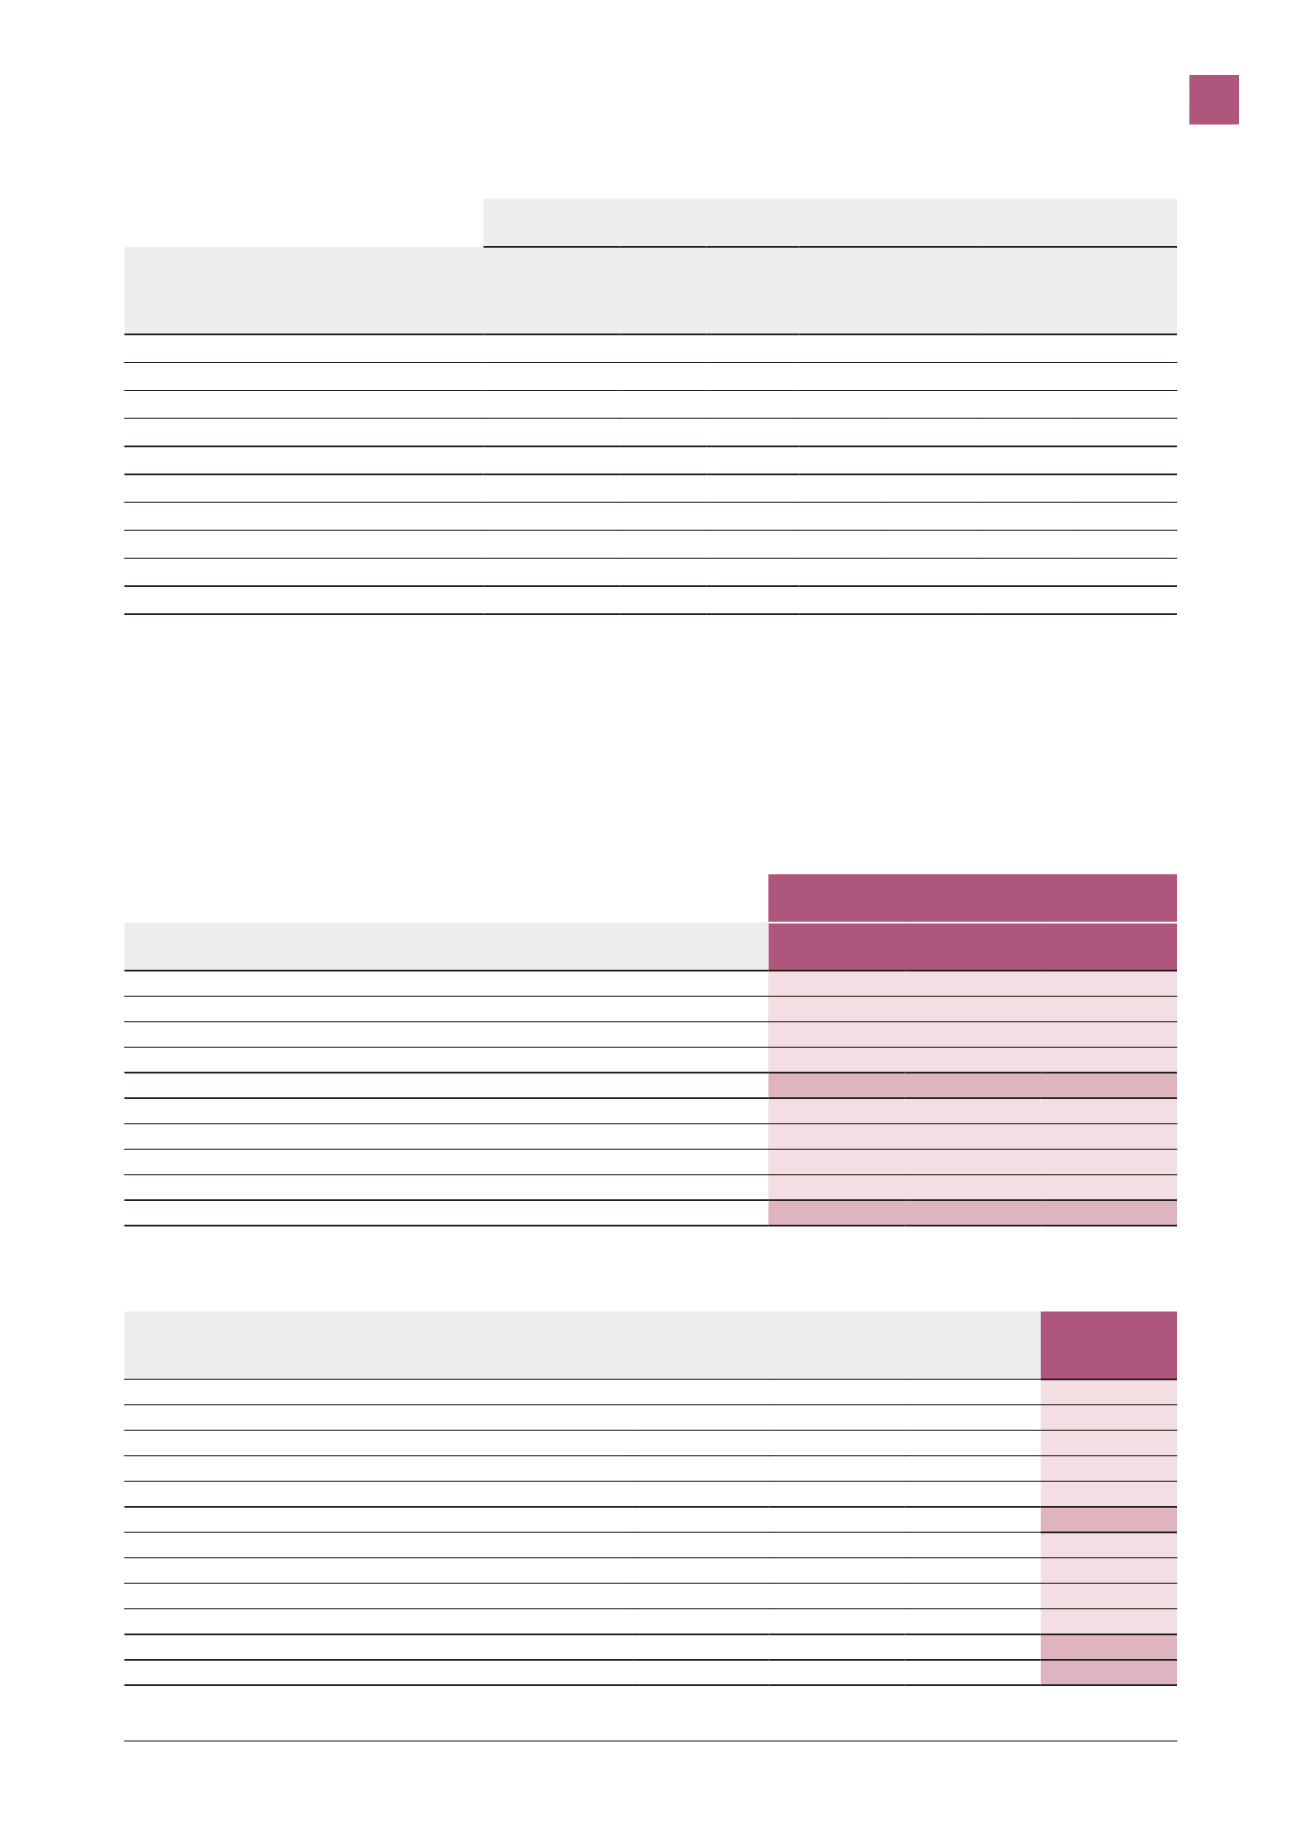
At 12/31/2015
Breakdown by instrument category
FINANCIAL ASSETS AND LIABILITIES RECORDED
ON BALANCE SHEET
(in €’000)
Net value
accounting
Fair
value
Fair
value via
earnings
Assets
available
for sale
Loans and
receivables
Debt at
depreciated
cost
Instruments
derivatives
Non-current financial assets
10,585 10,585
10,585
Other Non-current assets
924
924
924
Trade and other receivables
215,291 215,291
213,140
2,151
Cash and cash equivalents
125,812 125,812 125,812
TOTAL FINANCIAL ASSETS
352,612 352,612 125,812
224,649
2,151
Non-current borrowings
230,145 230,145
228,252
1,893
Other non-current financial liabilities (excl. PCA)
5,015
5,015
5,015
Current borrowings
52,285 52,285
52,285
Trade and other accounts payable
278,181 278,181
264,129
14,052
TOTAL FINANCIAL LIABILITIES
565,626 565,626
549,681
15,945
The IFRS 7 standard requires the hierarchical ordering of the different valuation techniques used for each of the financial instruments.
The categories are defined as follows:
Level 1:
direct reference to published prices of a market asset,
Level 2:
valuation technique based on measurable data,
Level 3:
valuation technique based on non-observable data.
Classification of fair value by hierarchical level:
12/31/2016
(in €’000)
Level 1
Level 2
Level 3
Non-current financial assets
9,481
Other Non-current assets
950
Trade and other receivables
260,416
Cash and cash equivalents
141,719
TOTAL FINANCIAL ASSETS
152,150
260,416
Non-current borrowings
253,856
Other non-current financial liabilities (excl. PCA)
5,365
Current borrowings
106,037
Trade and other accounts payable
23,426
281,066
TOTAL FINANCIAL LIABILITIES
388,684
281,066
2.5.1.4 Non-current financial assets
(in €’000)
Investments in
associates
Other non-current
investments
Other financial
assets
TOTAL
Gross values at December 31, 2015
1,509
7,636
1,448
10,593
Other net changes
(661)
147
(514)
Acquisitions
487
382
869
Disposals
(122)
(122)
Exchange rate differences
169
3
172
GROSS VALUES AT DECEMBER 31, 2016
7,631
1,858
9,489
Impairment at December 31, 2015
8
8
Other net changes
Provisions for impairment of assets
Reversals of impairment provisions
IMPAIRMENT AT DECEMBER 31, 2016
8
8
NET VALUES AT DECEMBER 31, 2016
7,623
1,858
9,481
CONSOLIDATED FINANCIAL STATEMENTS
3