


 46 / 158

46
LISI 2016 FINANCIAL REPORT
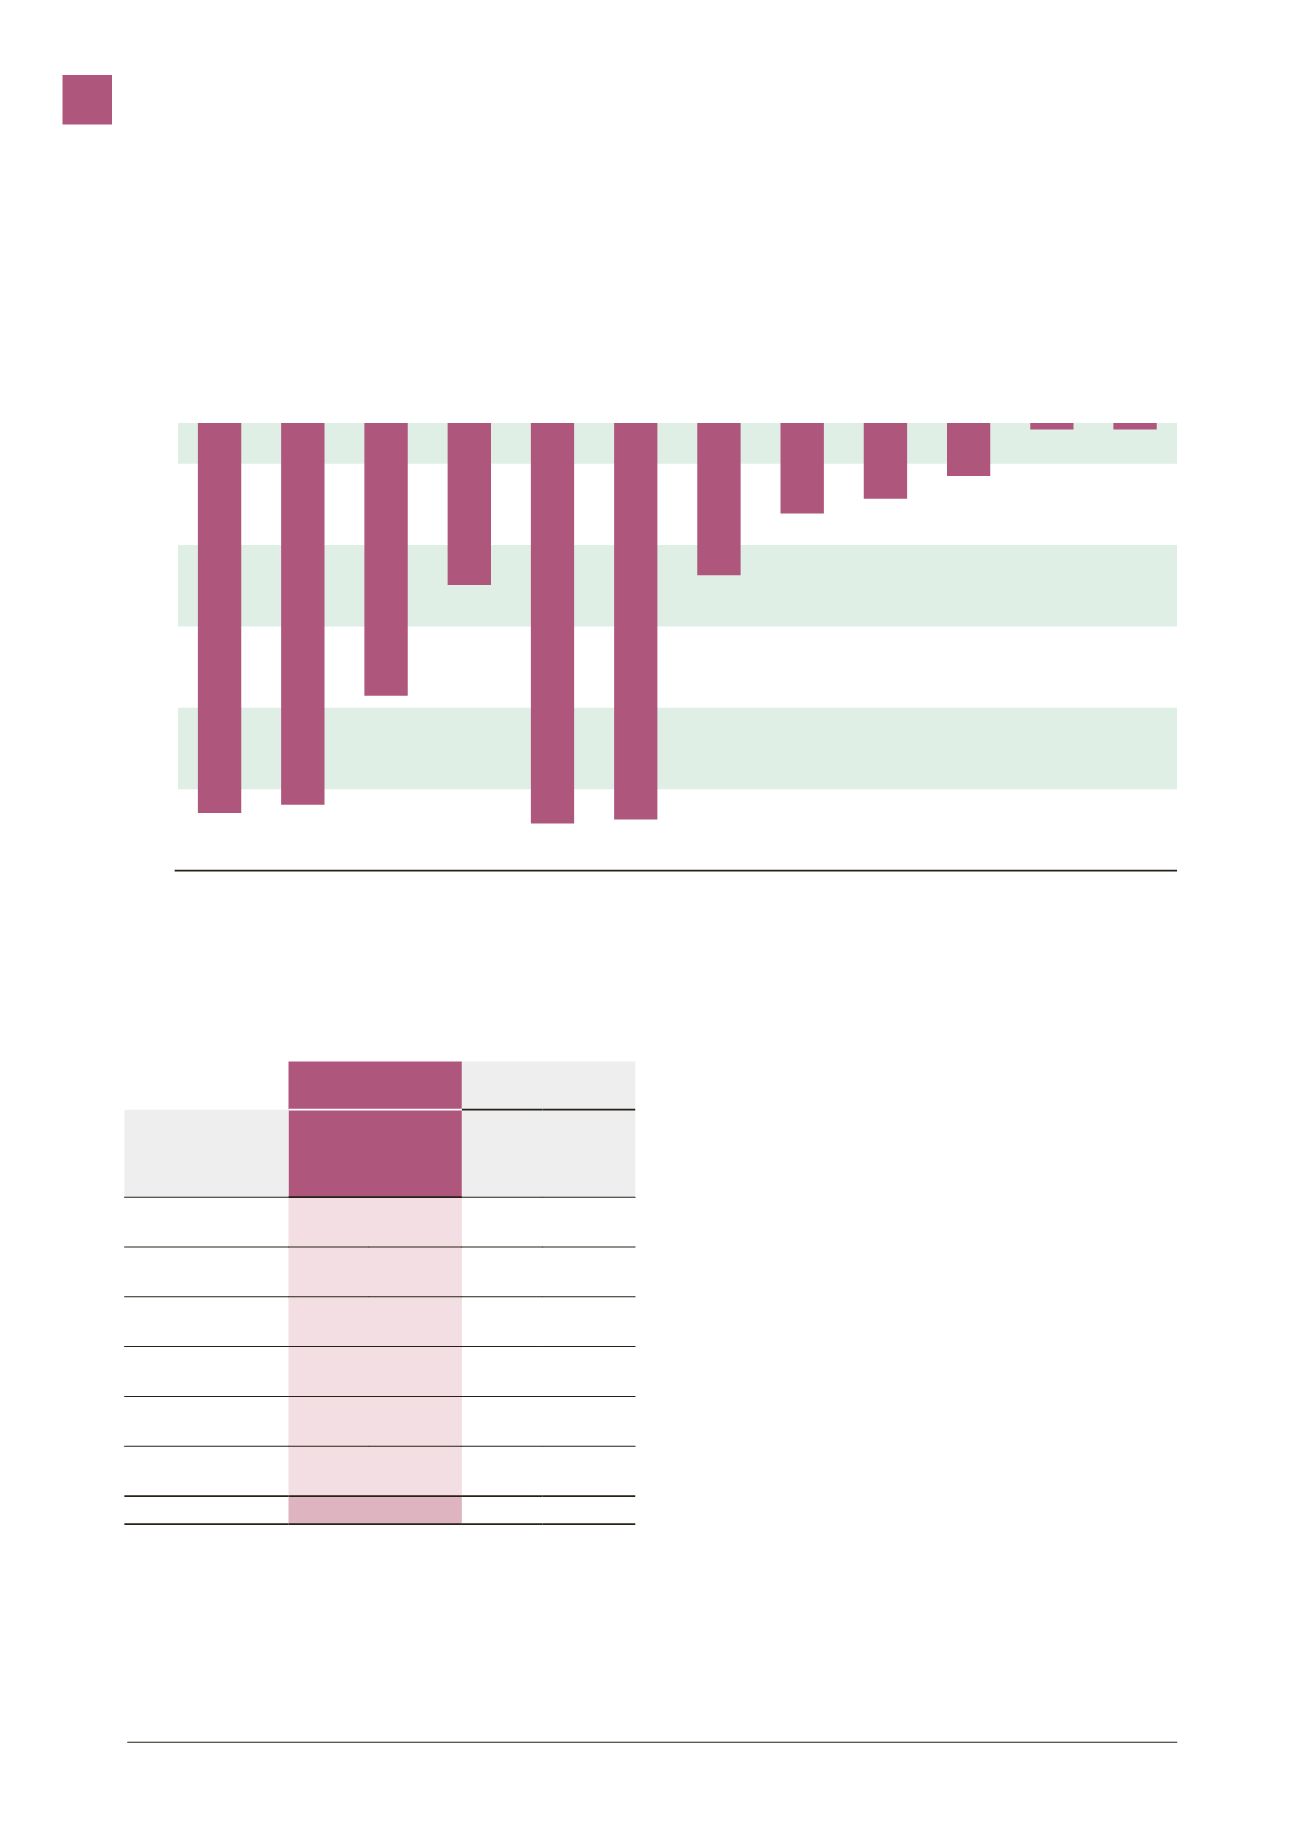
The graph below shows the Group’s financial leeway over ten years,
giving a total borrowing amount of €295 million. The difference with
the current and non-current borrowings shown above (€360 million vs.
€295 million) is primarily due to current banking facilities, employee
profit-sharing and leasing liabilities that are not included in the graph
below:
In €’000
Debt amortization profile at 12/31/2016
–55
–50
–45
–40
–35
–30
–25
–20
–15
–10
-5
0
2028
2027
2026
2025
2024
2023
2022
2021
2020
2019
2018
2017
–0.8
–0.8
–6.5
–9.3
–11.1
–18.7
–48.7
–49.2
–19.9
–33.5
–46.9
–47.9
2.4.3
I
Market risk
The main risks covered by the Group’s financial instruments are the
foreign currency risk and the interest rate risk. The fair value as at
December 31, 2016 of the derivatives used in the management of
market risks is detailed below:
12/31/2016
12/31/2015
(in €’000)
On the
assets
side
On the
liabilities
side
On the
assets
side
On the
liabilities
side
Interest rate risk
management
Variable rate
payers swaps
2,056
1,893
Currency risk
management
Foreign exchange
derivatives
23,281 2,151
14,052
Raw materials
management risk
Raw materials
derivatives
145
TOTAL
0 25,482 2,151 15,945
Market risk is the risk of variation in market prices, such as interest rates,
affecting the Group result or the value of financial instruments held.
Managing market risk involves controlling market risk and maintaining
it within acceptable limits, whilst optimizing the profitability risk ratio.
The Group buys and sells derivatives and supports financial liabilities
in order to manage market risk.
Hedging and market operations on interest rates, exchange rates or
securities using futures instruments are recorded in accordance with
the provisions of CRBF rules nos. 88-02 and 90-15. Commitments
relating to these transactions are posted to off-balance sheet
accounts for the nominal value of the contracts. As at December 31,
2016, the sum of these commitments represented the volume of
transactions that remained unsettled at year-end.
The accounting principles applied vary according to the nature of the
instruments and the operator’s initial intentions.
The commitments are detailed in paragraph 2.8.4.1 of chapter 3 of
this Annual Report.
2.4.3.1 Interest rate risk
The Group’s main exposure in terms of interest rate risk arises from the
exposure of its financial assets and liabilities at variable rates to variations
in interest rates, which could have an impact on these cash flows.
Within the framework of its overall policy, the Group partly converts its
initially variable rate liabilities into fixed rate liabilities, using financial
instruments such as interest rate swaps.
These hedging instruments are negotiated on OTC markets with
banking counterparts, in a centralized manner by the Group’s Financial
Department. They are not considered by the Group to be hedging
instruments and are recorded at fair value to the income statement.
CONSOLIDATED FINANCIAL STATEMENTS
3