


 88 / 171

 86
LISI 2018 FINANCIAL REPORT
COMPANY FINANCIAL STATEMENTS
4
86
LISI 2018 FINANCIAL REPORT
COMPANY FINANCIAL STATEMENTS
4
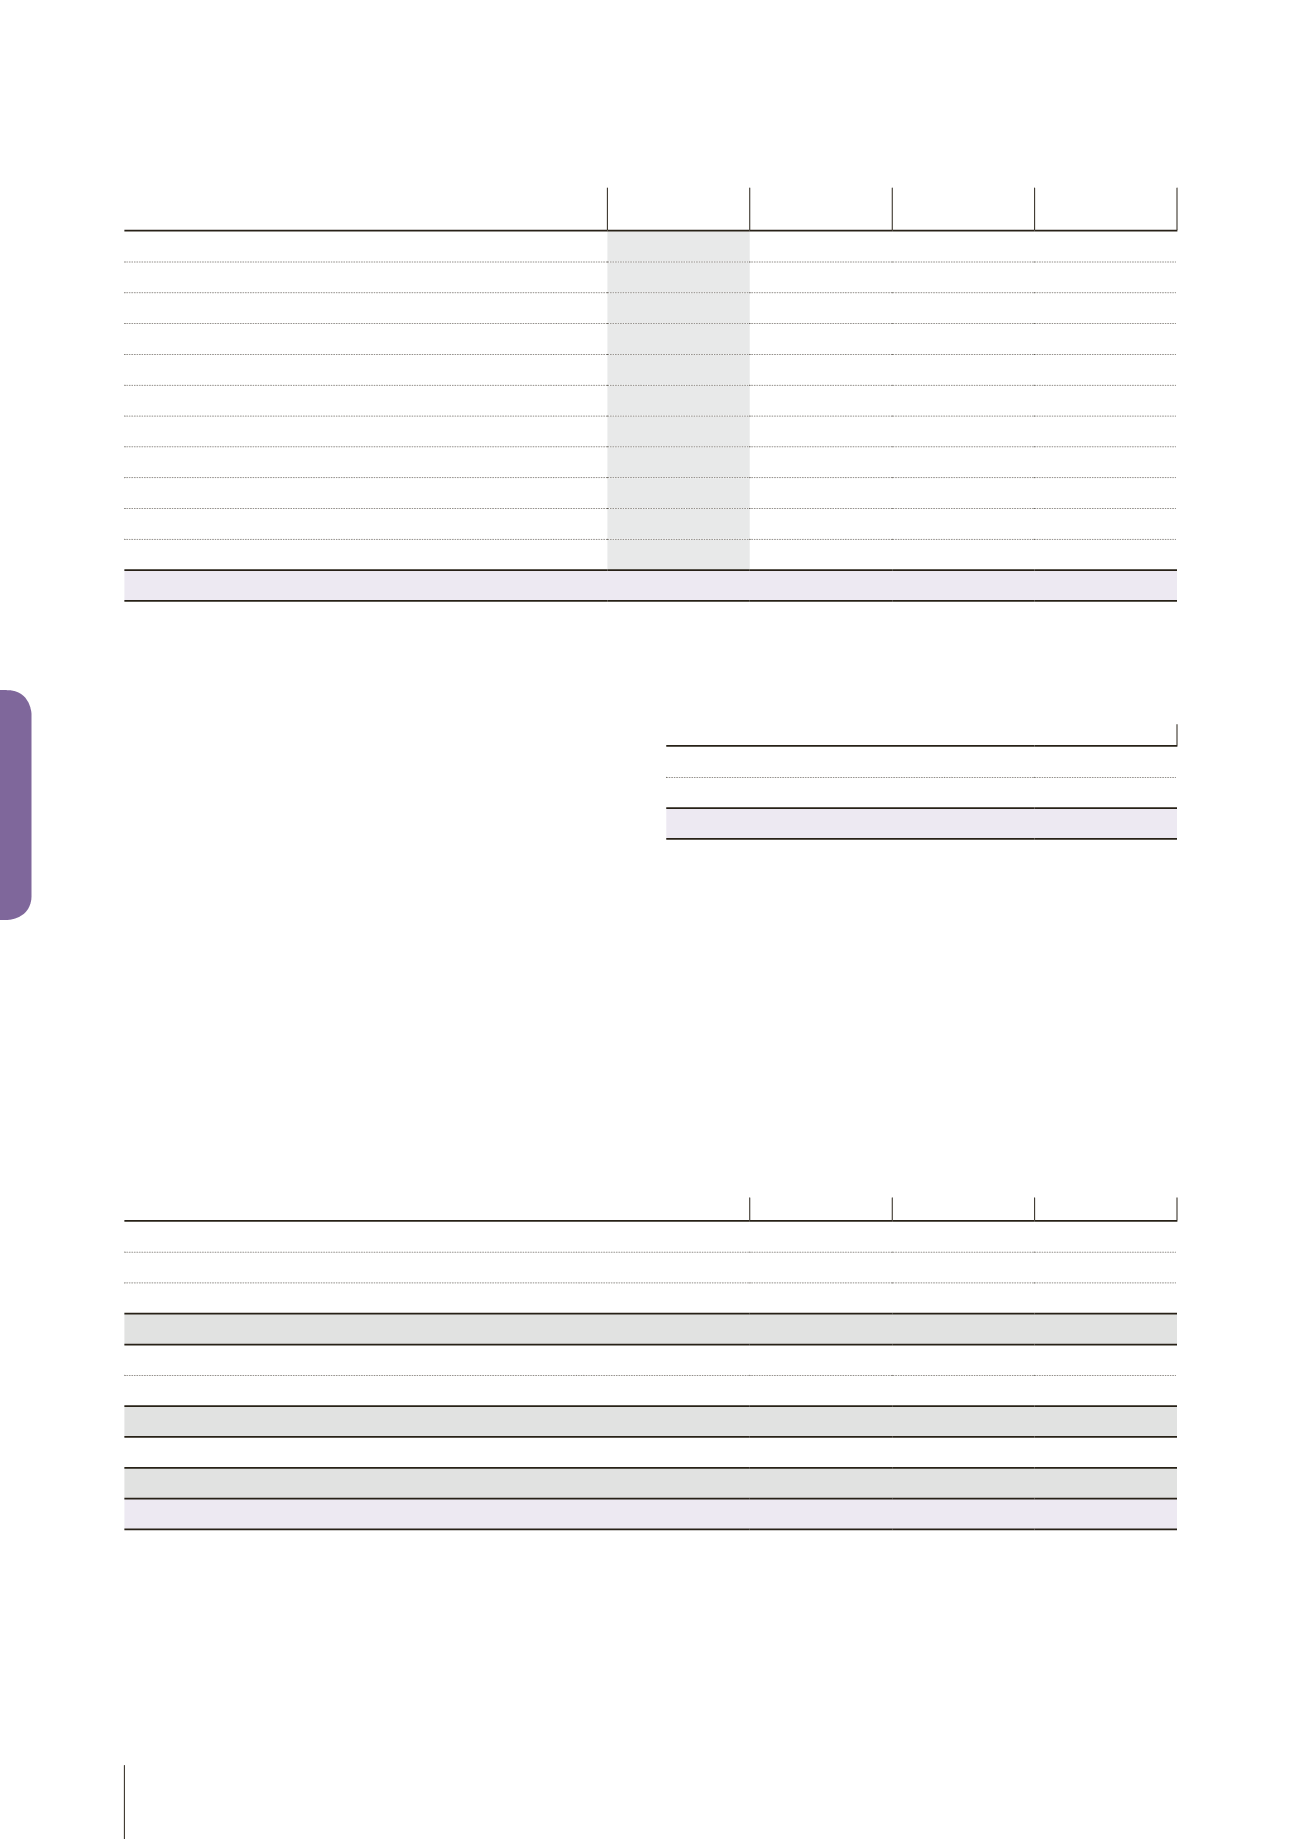
DEBT (in thousands of euros)
Gross amount
year-end
Less than
1 year
1 to
5 years
More than
5 years
Loans and debts from credit institutions:
at a maximum of 1 year when contracted
11,120
11,120
at more than 1 year when contracted
230,486
24,550
181,995
23,941
Sundry loans and financial debts
101,502
101,502
Accounts payable and apportioned accounts
1,880
1,880
Debt on fixed assets and apportioned accounts
61
61
Tax and statutory payments
1,897
1,897
Income tax
Tax integration current accounts
18,642
18,642
Subsidiaries’ current accounts
249,880
249,880
Other creditors
TOTAL
615,468
409,532
181,995
23,941
OnDecember31,2018,the item“Loansanddebtsfromcredit institutions”
includes the issuance of unsecured notes on the US private placement
market (USPP: US private placement) on October 17, 2013 for an amount
of €40 million, on March 20, 2015 for an amount of €20 million and on
March 4, 2016 for an amount of €40million.
“Financial covenants” related to this debt are:
■■
Consolidated gearing ratio < 1.2 (Net debt/Shareholders’ equity);
■■
Consolidated Leverage ratio < 3.5 (Net debt/EBITDA);
■■
Coverage ratio of consolidated interest expense < 4.5 (Net interest
expense/EBITDA).
As of December 31, 2018, the balance of the item “Borrowings and debt”
includes the drawdown of commercial paper (NEUCP) issued on the debt
money market for an amount of €101 million.
3.2.6
I
Marketable securities and cash
3.2.6.1 - Marketable securities
As at December 31, 2018, marketable securities were as follows:
(in thousands of euros)
914,553 LISI shares*
7,676
SICAV and deposit certificates
95,940
Giving a gross total of
103,616
* 914,553 shares held, under the delegation for the purpose of buying back the
Company’s own shares up to a limit of 10%, including those held under themarket-
making contract.
The item “Marketable securities” essentially comprises money market
funds for €82.5 million and guaranteed-capital investments for
€13.4million.
The total net asset value of marketable securities stood at €82.5 million
as at December 31, 2018.
3.2.6.2 - Cash
This item is solely composed of bank balances.
3.2.6.3 - Cash and Net debt
(in thousands of euros)
2018
2017
2016
Subsidiaries’ current accounts
481,950
395,058
399,705
Marketable securities
103,616
133,194
101,350
Cash
14,314
42,500
22,453
Cash available [A]
599,880
570,752
523,508
Subsidiaries’ current accounts [B]
249,880
270,781
220,007
Banking facilities for operations [B]
11,092
24
Net cash [A - B]
338,908
299,947
303,501
Borrowings and debt
343,108
352,016
286,748
Debt [C]
343,108
352,016
352,016
Net debt [D = C + B - A]
4,200
52,069
(16,753)