


 84 / 171

 82
LISI 2018 FINANCIAL REPORT
COMPANY FINANCIAL STATEMENTS
4
82
LISI 2018 FINANCIAL REPORT
COMPANY FINANCIAL STATEMENTS
4
2.3
I
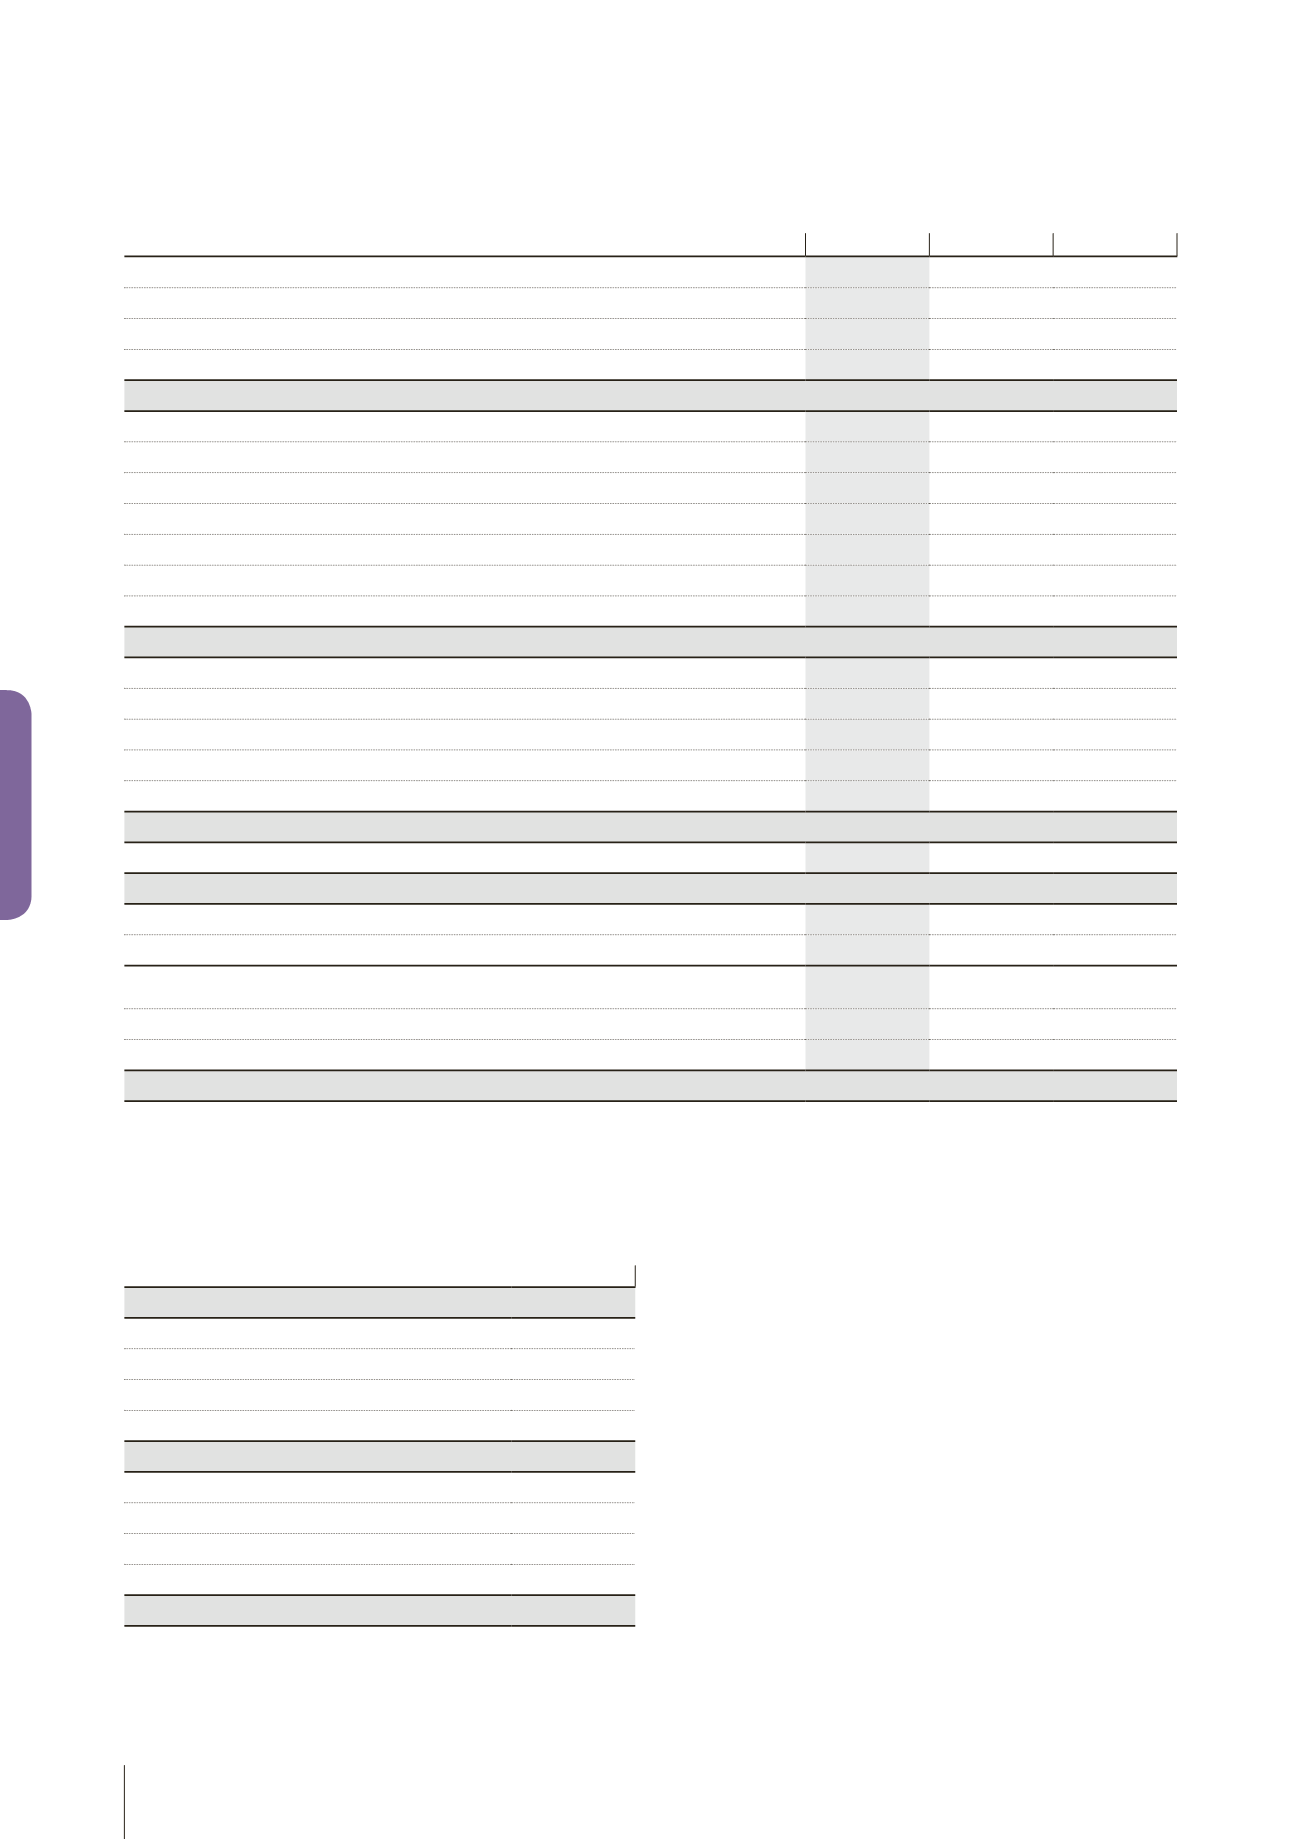
Cash flow statement at 12/31/2018
(in thousands of euros)
2018
2017
2016
Operating activities
Operating cash flow
39,900
25,622
33,630
Effect of changes in inventory on cash
Effect of changes in accounts receivable and accounts payable
14,046
(32,546)
17,433
Cash provided by or used for operations (A)
53,946
(6,924)
51,063
Investment operations
Cash used to acquire tangible and intangible fixed assets
(1,185)
(1,474)
(205)
Cash received from the disposal of tangible and intangible fixed assets
489
100
Cash used to acquire financial assets
Cash received from the disposal of financial assets
Net cash used for acquisitions and disposals of subsidiaries
Cash payments and collections from loans to subsidiaries
28,921
(48,938)
(45,455)
Cash provided by or used for investing activities (B)
27,736
(49,923)
(45,560)
Financing operations
Cash received from shareholders as part of a capital increase
2,781
Dividends paid to shareholders of the parent company
(25,499)
(23,872)
(20,629)
Cash received from new loans
30,811
119,836
129,323
Repayment of loans
(50,814)
(42,671)
(70,026)
Cash provided by or used for financing activities (C)
(42,721)
53,293
38,668
Effect of change in foreign exchange rates (D)
Changes in cash (A+B+C+D) *
38,961
(3,554)
44,171
Cash at January 1 (E)
299,947
303,501
259,330
Cash at December 31 (A+B+C+D+E)
338,908
299,947
303,501
Marketable securities
103,616
133,194
101,350
Cash, subsidiaries’ current accounts
496,264
437,558
422,158
Banking facilities, subsidiaries’ current accounts
(260,972)
(270,805)
(220,007)
Closing cash position **
338,908
299,947
303,501
* Overall change in cash position corresponds to the total of net cash flows generated by the various categories: operations, CAPEX, and financing.
** The cash position is the algebraic sumof the balance sheet assets and liabilities.
2.4
I
Change in shareholders’ equity
at 12/31/2018
(in thousands of euros)
At 12/31/2016
221,223
Profit (loss) for the period
20,111
Capital increase
Dividends paid
(23,872)
Accelerated depreciation
(26)
At 12/31/2017
217,488
Profit (loss) for the period
42,296
Capital increase
2,781
Dividends paid
(25,499)
Accelerated depreciation
(29)
At 12/31/2018
237,037