


 71 / 171

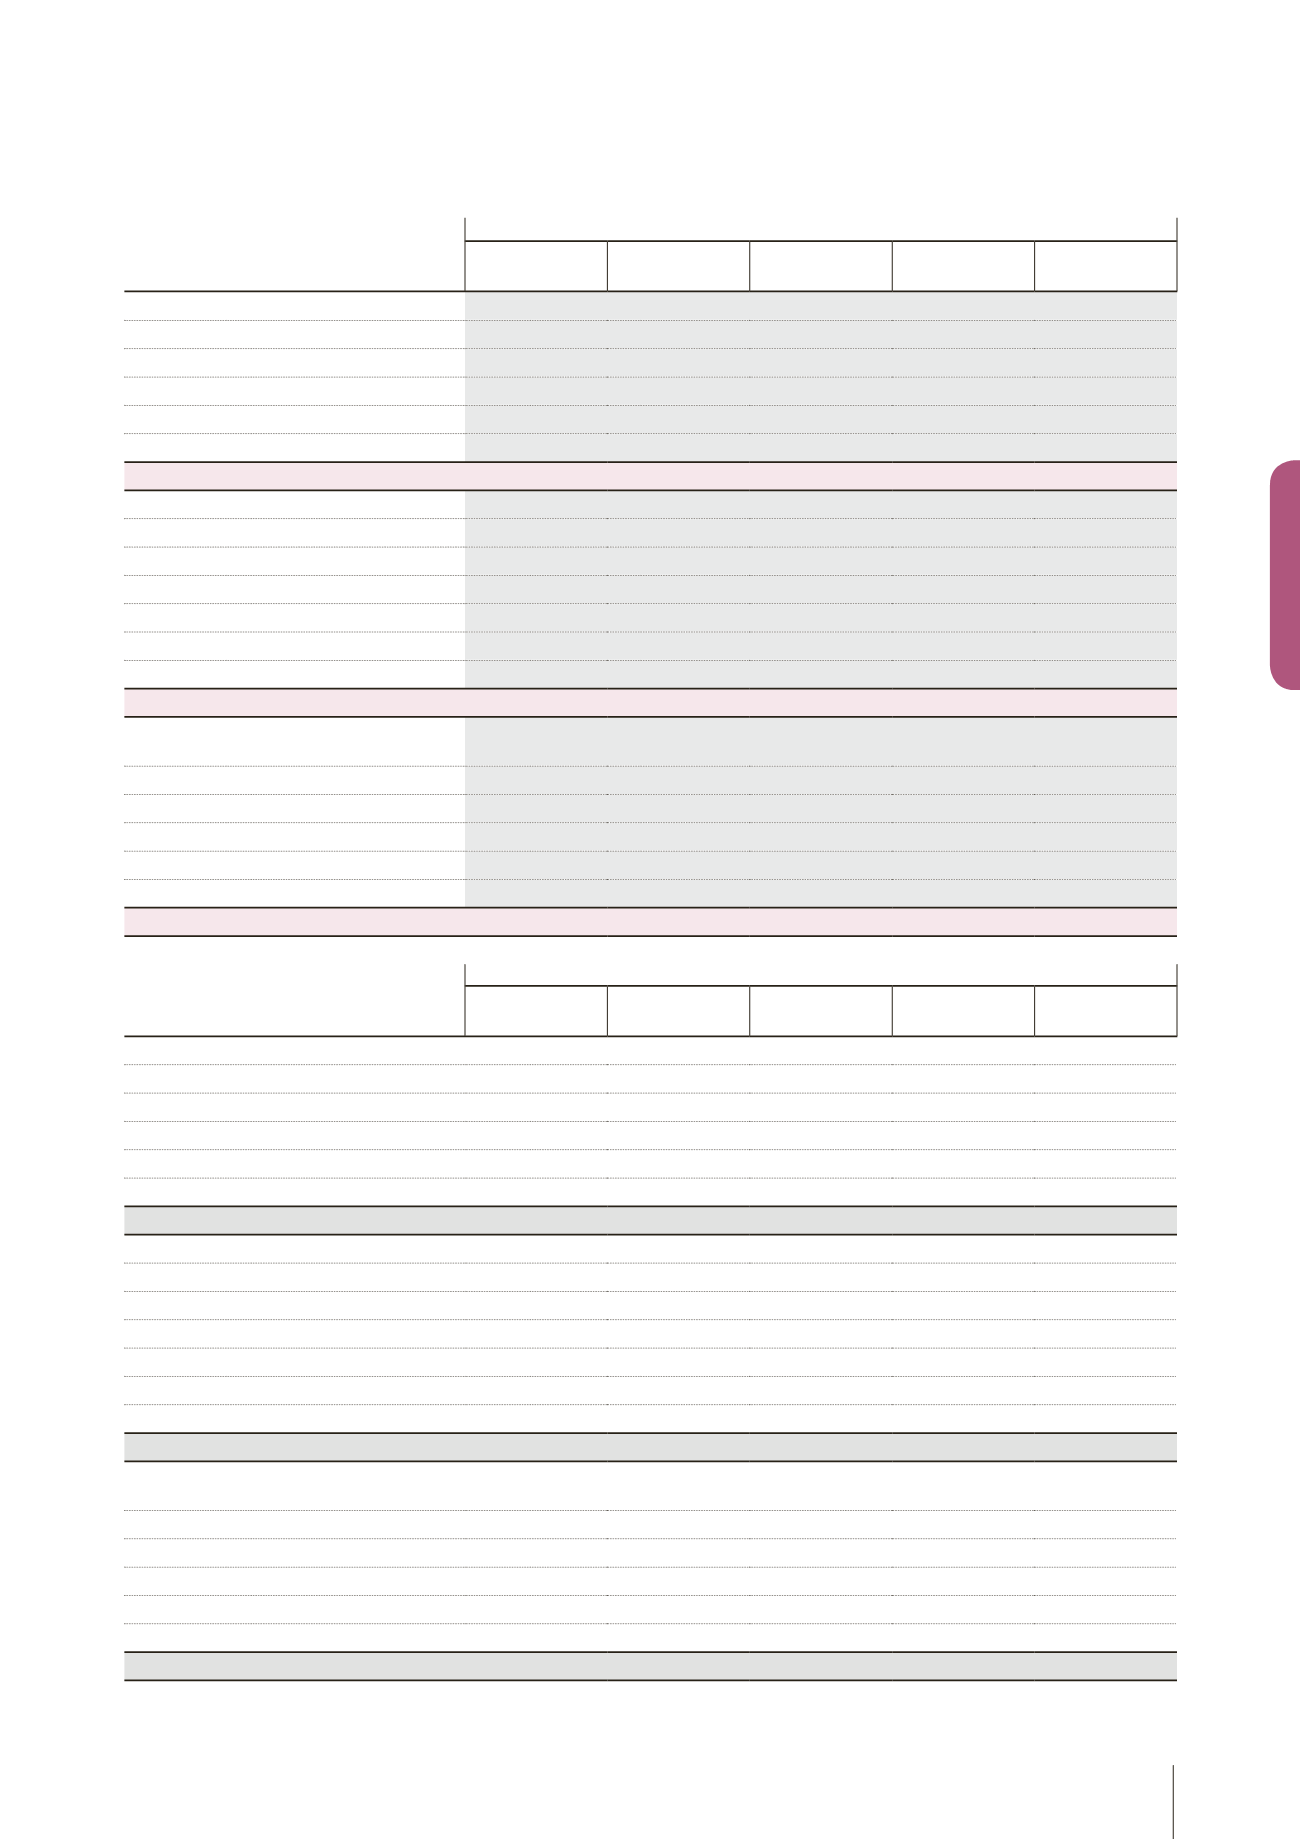
2.7.1.2 - Breakdown by business sector and by country
12/31/2018
(in thousands of euros)
LISI
AEROSPACE
LISI
AUTOMOTIVE
LISI
MEDICAL
Other
TOTAL
Income Component
Sales revenue by destination area
European Union
626,433
396,427
62,218
(785)
1,084,293
of which France
411,668
151,360
8,806
(785)
571,049
North American continent
250,745
71,684
64,012
386,441
Other countries
56,833
113,024
4,504
174,361
Total
934,011
581,135
130,734
(785)
1,645,095
Balance sheet component
Net fixed assets by destination area
European Union
386,997
258,974
66,202
(101,853)
610,320
of which France
360,619
161,669
66,202
(101,853)
486,638
North American continent
197,810
99,655
100,570
398,035
Africa
18,263
678
18,941
Asia
25,602
7,443
33,045
Total
628,672
366,750
166,772
(101,853)
1,060,341
Flows provided by or used for acquisition of fixed
assets by destination area
European Union
60,927
34,996
4,623
1,185
101,731
of which France
56,078
21,472
4,623
1,185
83,358
North American continent
8,145
9,639
6,291
24,075
Africa
2,624
83
2,707
Asia
4,177
1,413
5,590
Total
75,873
46,129
10,914
1,185
134,103
12/31/2017
(in thousands of euros)
LISI
AEROSPACE
LISI
AUTOMOTIVE
LISI
MEDICAL
Other
TOTAL
Income Component
Sales revenue by destination area
European Union
670,062
407,031
58,213
(558)
1,134,748
of which France
415,977
159,453
10,158
(688)
584,900
North American continent
250,623
35,574
73,873
360,070
Other countries
80,206
63,397
4,935
148,538
Total
1,000,891
506,002
137,021
(558)
1,643,356
Balance sheet component
Net fixed assets by destination area
European Union
372,172
255,286
60,377
(244,294)
462,764
of which France
346,437
160,107
60,380
(244,294)
339,089
North American continent
194,040
51,069
95,871
146,973
513,818
Africa
16,816
16,816
Asia
25,102
7,718
33,045
Total
608,130
314,073
156,248
(97,321)
1,027,887
Flows provided by or used for acquisition of fixed
assets by destination area
European Union
75,427
34,231
2,606
1,171
113,435
of which France
68,572
19,016
2,606
1,171
89,366
North American continent
10,478
1,526
8,289
20,293
Africa
3,037
3,037
Asia
2,763
2,167
4,930
Total
91,705
37,922
10,895
1,171
141,695
69 LISI 2018 FINANCIAL REPORT CONSOLIDATED FINANCIAL STATEMENTS 3