80
I LISI FINANCIALREPORT2013
COMPANYFINANCIALSTATEMENTS
4
3.8
|
MISCELLANEOUS INFORMATION
n
The company directors and executives have not been given any
advancesorcredits.
n
Remuneration of executives stood at €782,179 for the year 2013
(remuneration net of social security contributions, including the
variableelementandattendance fees).
n
The total remunerationpaid to the highest-paid individuals stood at
€1,601,338.
n
TheworkforceasatDecember31,2013numbered18 individuals.
n
Retirement commitments have not been given, as they do not
representasignificantamount.
n
Commitments relating to the Individual Right toTraining (the French
continuing professional development scheme) represent a total
amount of training time corresponding to accumulated rights of
around 1,524 hours as at December 31, 2013. Inmost cases, training
requests forthistimehavenotbeenmade.
n
Thecompanydoesnothaveany leasingagreements.
n
Fees entered for the financial year endingDecember 31, 2013 for our
auditorsErnst&YoungandEXCOCAPAUDITtotaled€98,189.
4
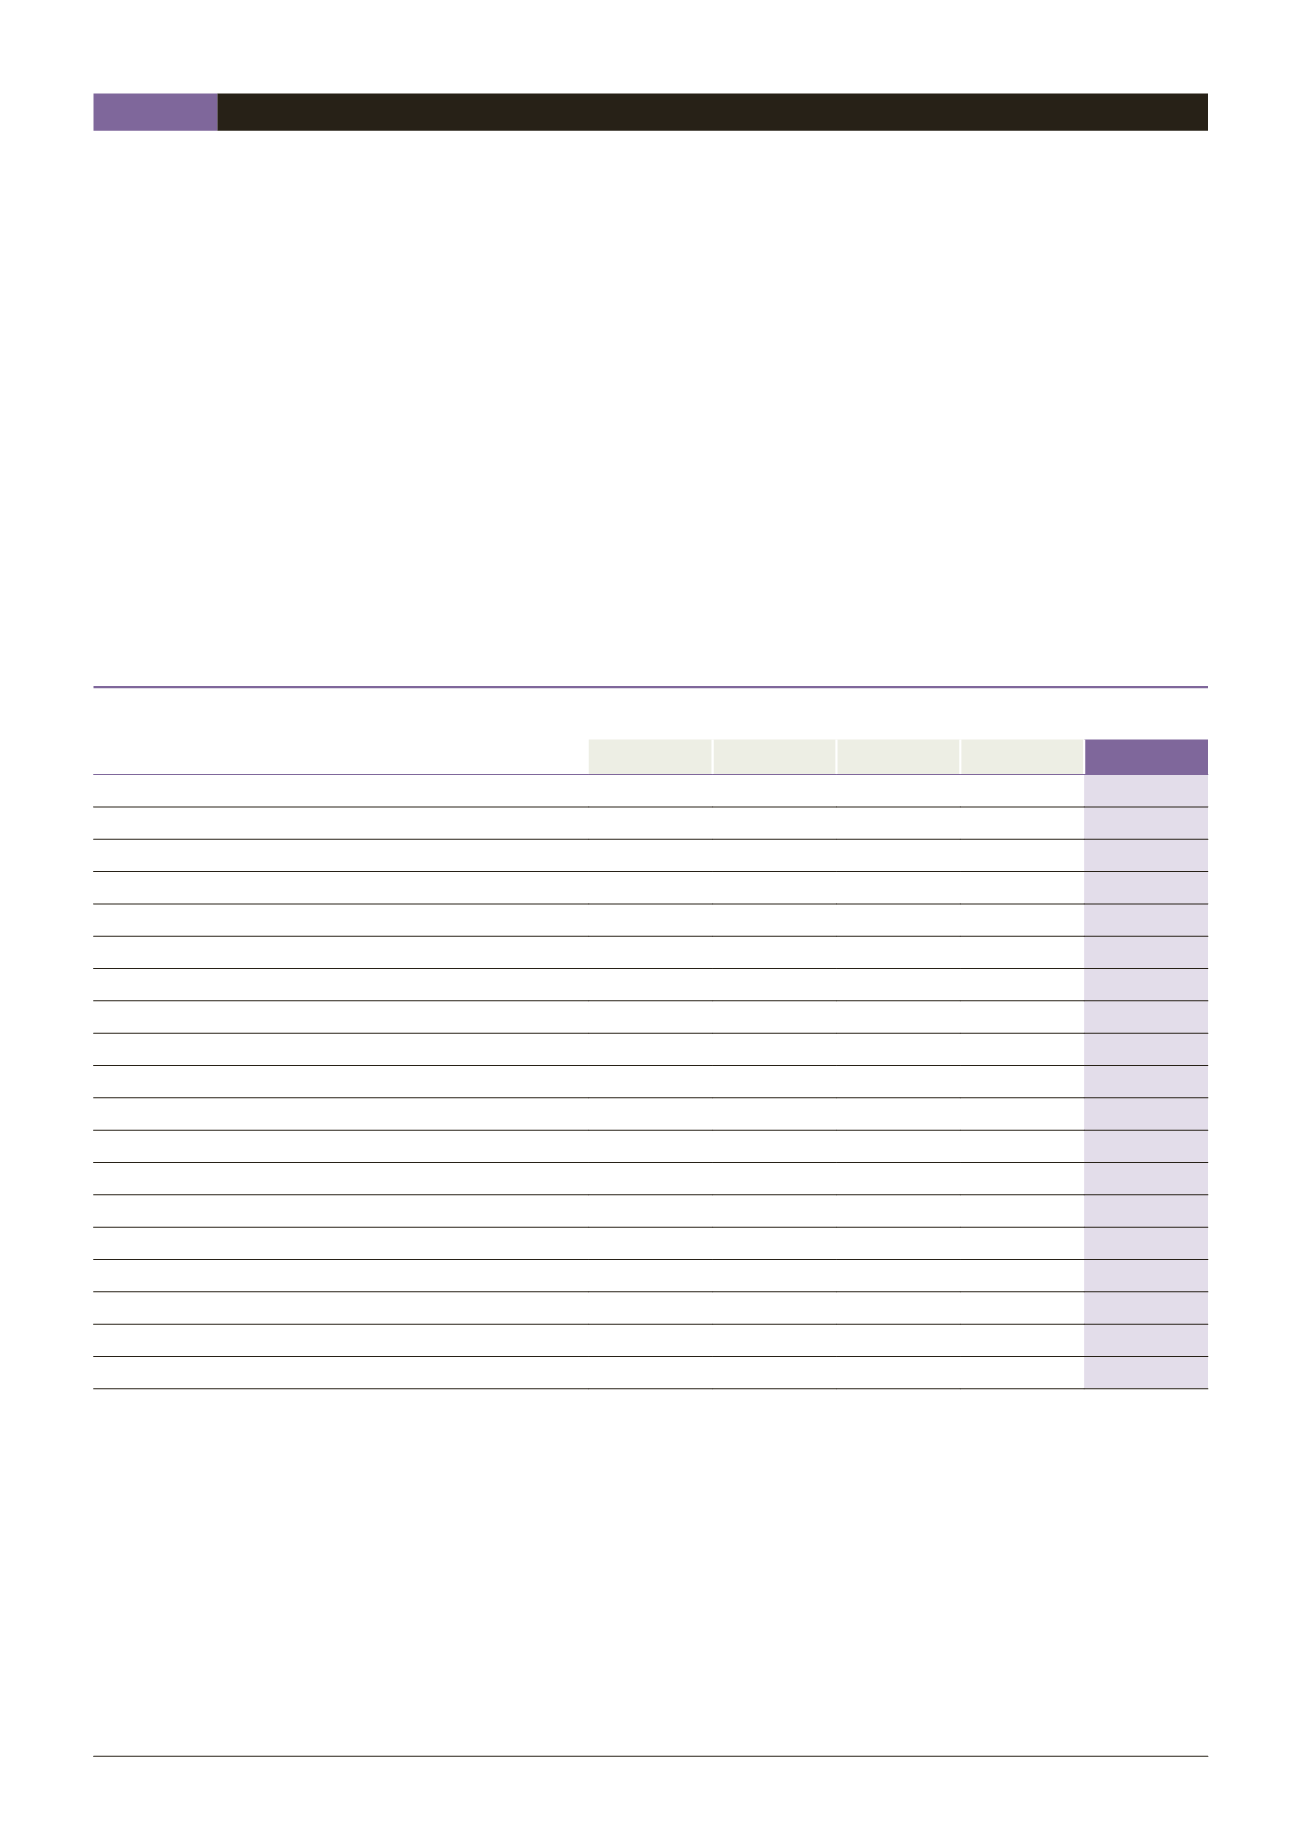
| FINANCIALRESULTSFORLISI S.A. OVERTHEPASTFIVEYEARS
(articles133, 135and148oftheDecreeonCommercialCompanies)
Nature of indications (in€)
2009
2010
2011
2012
2013
Financialsituationatyearend
Sharecapital
21,507,722
21,572,988
21,572,988
21,572,988
21,572,988
Numberof shares issued
10,753,861
10,786,494
10,786,494
10,786,494
10,786,494
Numberof convertiblebonds
237,324
Totalresultofactualoperations
Pre-taxsales
5,042,665
5,937,895
6,215,920
6,843,565
8,569,903
Earningsbefore tax,depreciationandprovisions
10,899,256
11,266,365
15,987,962
14,163,291
13,571,588
Income tax
(5,658,143)
2,498,851 (1,977,461)
(1,567,669)
(8,584,787)
Employeeprofit-sharing
Profitafter tax,depreciationandprovisions
21,797,508
7,725,772
19,308,622
17,144,076
20,550,519
Distributedprofit*
7,216,048
10,913,195
13,530,664
15,101,092
18,337,040
Resultofoperationspershare
Profitafter tax,butbeforedepreciationandprovisions
1.54
0.81
1.67
1.46
2.05
Profitafter tax,depreciationandprovisions
2.03
0.72
1.79
1.59
1.91
Dividendsallocatedper share (net)
0.70
1.05
1.30
1.40
1.70
Personnel
Averageheadcount
13
13
13
16
18
Payroll
1,172,136
4,757,164
2,039,051
2,482,746
2,786,748
Benefitspaid (social security,benefits,etc.)
689,460
897,505
983,773
1,350,914
1,870,596
*Afterdeductingthedividendthatwouldhaveconcernedtheownsharesheldbythecompany fortheyears2009to2012.


