


 55 / 171

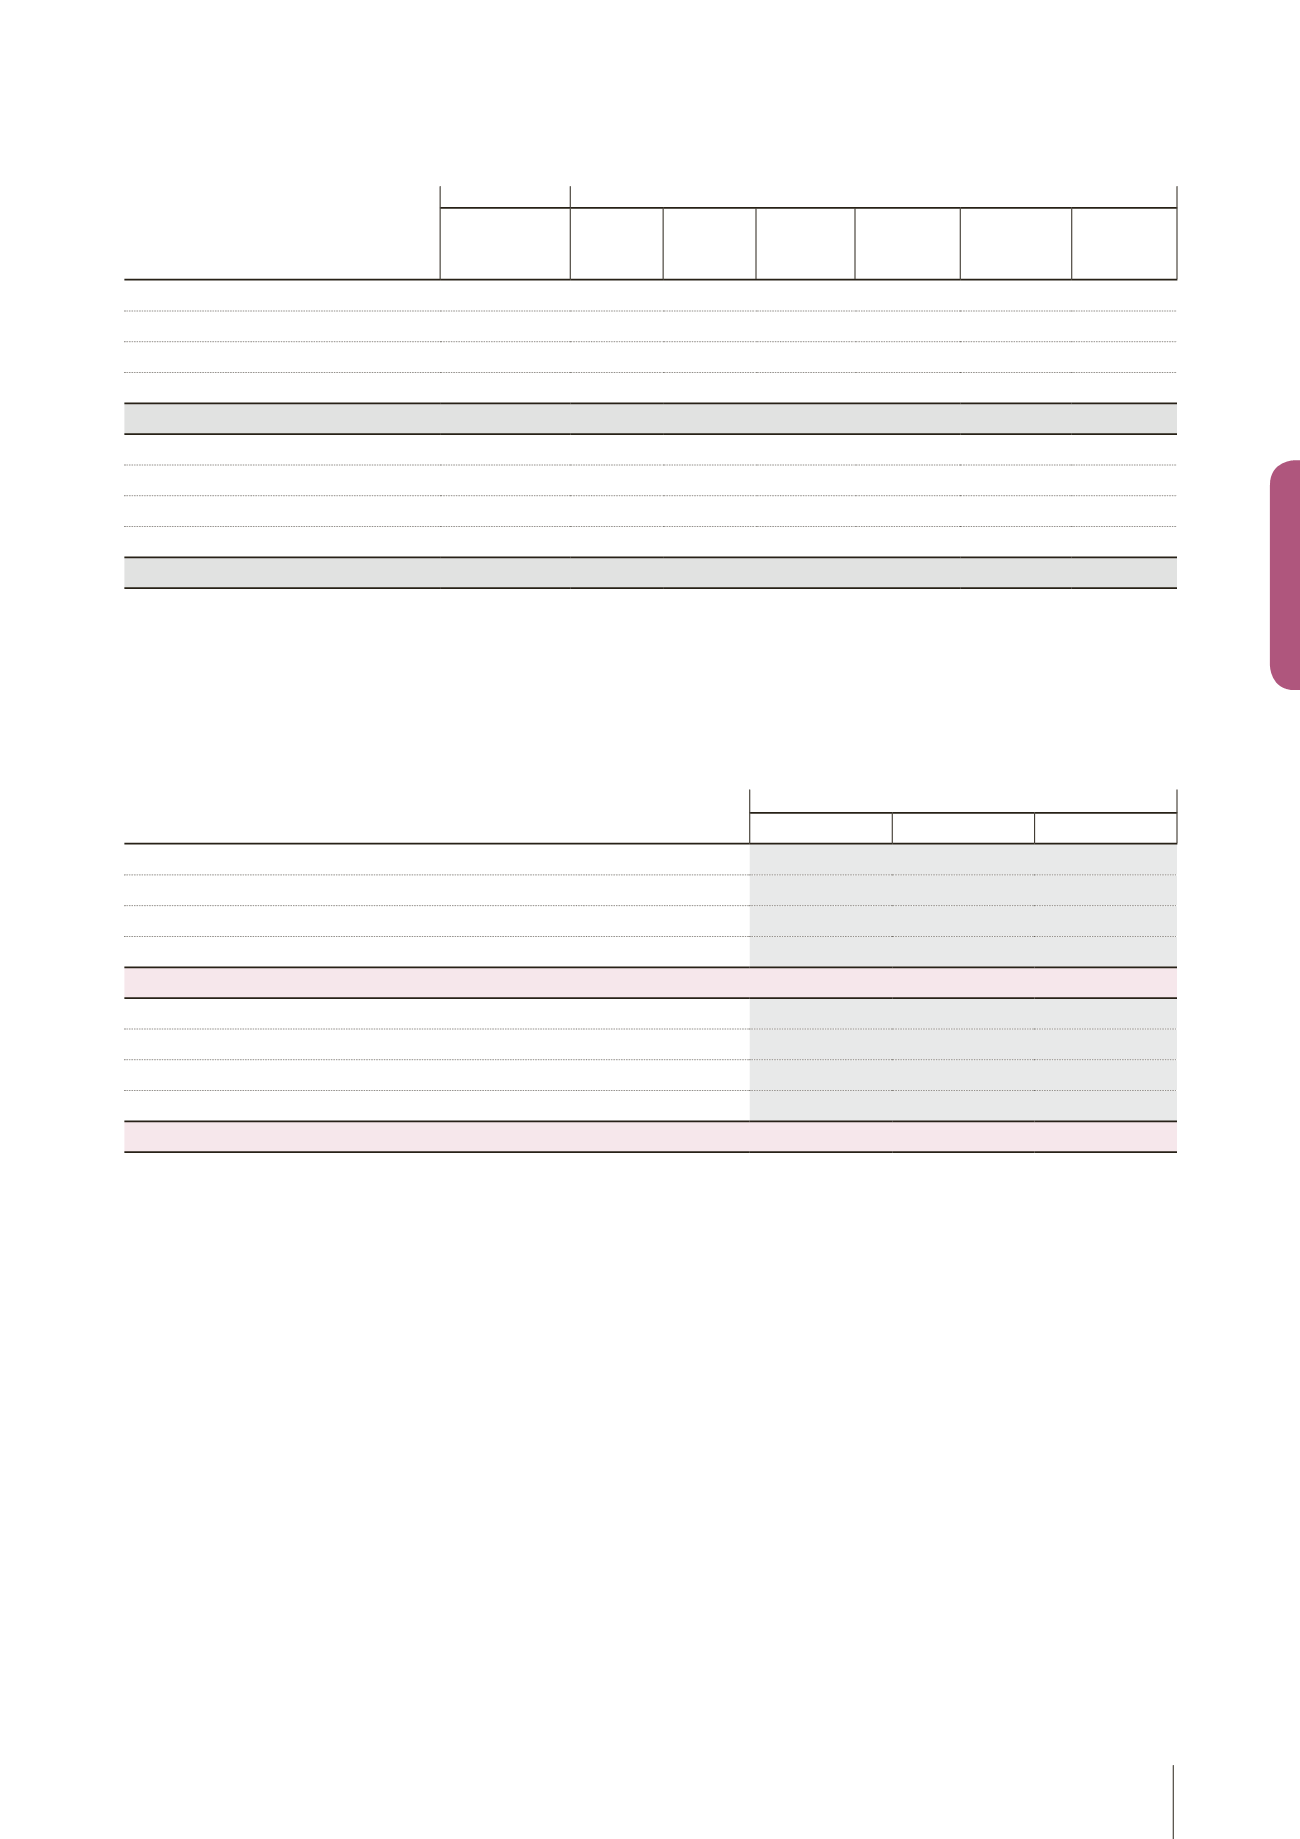
At 12/31/2017
Breakdown by instrument category
Financial assets and liabilities
on the balance sheet
(in thousands of euros)
Net value
accounting Fair value
Fair value
via
earnings
Assets
available
for sale
Loans and
receivables
Debt at
depreciated
cost Derivatives
Non-current financial assets
9,982
9,982
9,982
Other non-current assets
429
429
429
Trade and other receivables
261,249
261,249
244,674
16,575
Cash and cash equivalents
197,576
197,576
197,576
Total financial assets
469,236 469,236
197,576
255,085
16,575
Non-current borrowings
317,757
317,757
316,448
1,309
Othernon-currentfinancial liabilities (excl.PCA)
4,678
4,678
4,678
Current borrowings
179,973
179,973
179,973
Trade and other accounts payable
297,109
297,109
296,504
605
Total financial liabilities
799,517
799,517
797,603
1,914
The IFRS 7 standard requires the hierarchical ordering of the different valuation techniques used for each of the financial instruments. The categories
are defined as follows:
Level 1:
direct reference to published prices of a market asset;
Level 2:
valuation technique based onmeasurable data;
Level 3:
valuation technique based on non-observable data.
Classification of fair value by hierarchical level:
December 31, 2018
(in thousands of euros)
Level 1
Level 2
Level 3
Non-current financial assets
8,923
Other non-current assets
480
Trade and other receivables
2,147
260,994
Cash and cash equivalents
156,879
Total financial assets
168,429
260,994
Non-current borrowings
337,354
Other non-current financial liabilities (excl. PCA)
1,734
Current borrowings
158,831
Trade and other accounts payable
2,272
296,197
Total financial liabilities
500,191
296,197
53 LISI 2018 FINANCIAL REPORT CONSOLIDATED FINANCIAL STATEMENTS 3