


 54 / 171

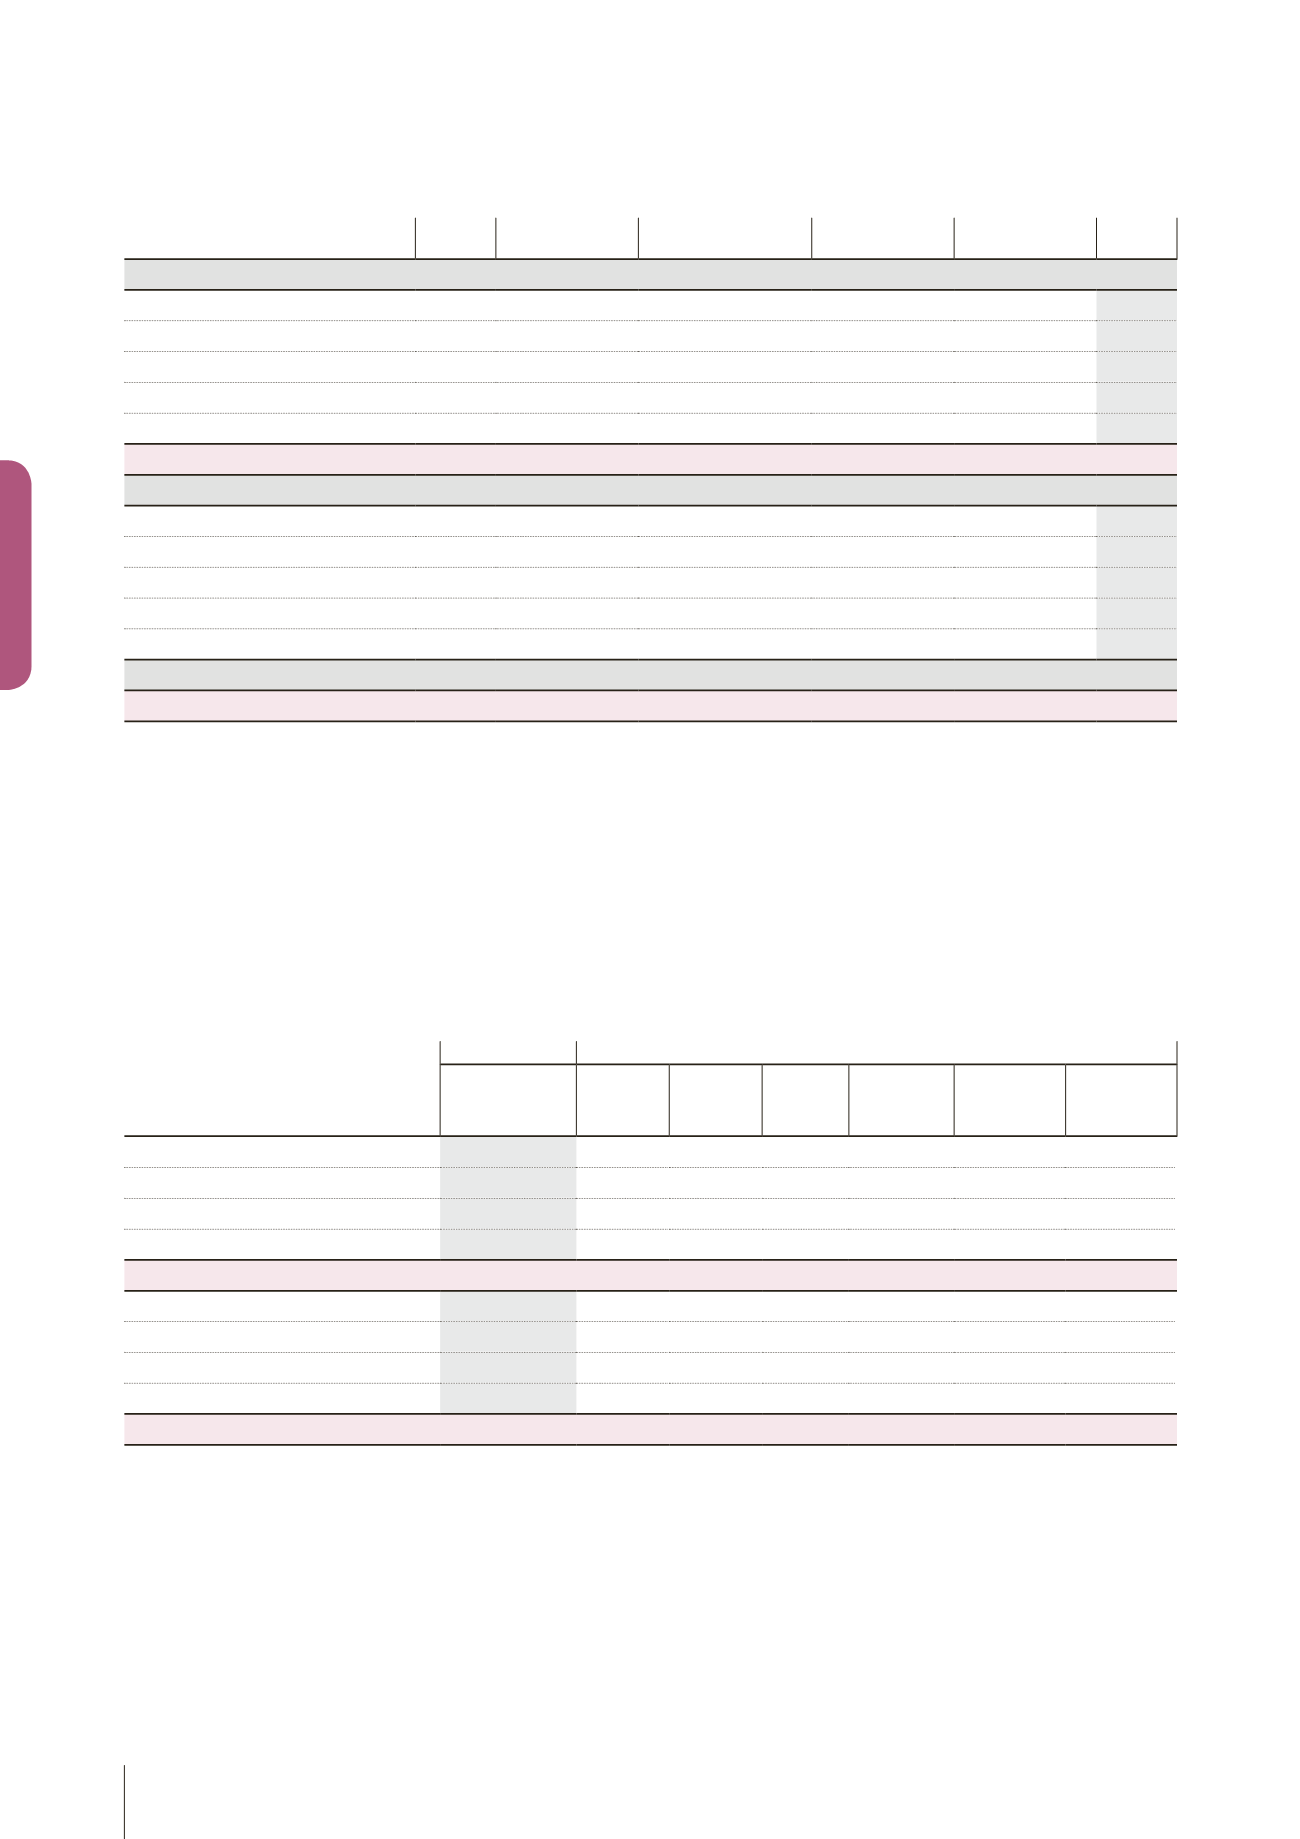
b) Tangible assets held under a finance lease contract
(in thousands of euros)
Land
Buildings
Technical facilities,
equipment and tools
Other tangible
assets Current assets
TOTAL
Gross values at December 31, 2017
13,833
32,300
46,133
Other changes
160
160
Acquisitions
4,296
4,296
Disposals
(1,493)
(1,493)
Scope changes
278
278
Exchange rate differences
257
358
615
Gross values at December 31, 2018
18,824
31,165
49,989
Depreciation at December 31, 2017
5,167
24,055
29,224
Other changes
20
(1,493)
(1,473)
Depreciation allowance
305
2,497
2,802
Depreciation reversals
Scope changes
168
168
Exchange rate differences
26
141
167
Depreciation at December 31, 2018
5,687
25,202
30,889
Net values at December 31, 2018
13,136
5,963
19,099
Given their immaterial nature, the minimum future payments in respect
of rents and their current value are not broken down by maturity.
c) Operating lease agreements
The main assets required for operations that do not belong to the Group
or its subsidiaries are industrial buildings and office space (head office).
Other operating lease agreements are mainly for office equipment and
vehicle leases.
No significant commercial leases have been signed with company
executives or with companies belonging to executives or their families.
The total annual expense is approximately €21 million, compared to
€19 million in 2017.
2.5.1.3 - Financial assets and liabilities
Financial assets and liabilities recorded on the balance sheet are broken down into the following accounting categories and classes of financial
instruments:
At 12/31/2018
Breakdown by instrument category
Financial assets and liabilities
on the balance sheet
(in thousands of euros)
Net value
accounting Fair value
Fair value
via
earnings
Assets
available
for sale
Loans and
receivables
Debt at
depreciated
cost
Derivatives
Non-current financial assets
8,923
8,923
8,923
Other Non-current assets
480
480
480
Trade and other receivables
263,141
263,141
260,994
2,147
Cash and cash equivalents
156,879
156,879
156,879
Total financial assets
429,423 429,423
156,879
270,397
2,147
Non-current borrowings
337,354 337,354
336,165
1,189
Othernon-currentfinancial liabilities (excl.PCA)
1,734
1,734
1,734
Current borrowings
158,831
158,831
158,831
Trade and other accounts payable
298,469 298,469
296,197
2,272
Total financial liabilities
796,388 796,388
792,927
3,461
52 LISI 2018 FINANCIAL REPORT CONSOLIDATED FINANCIAL STATEMENTS 3