


 25 / 171

 23
LISI 2018 FINANCIAL REPORT
FINANCIAL SITUATION
2
23
LISI 2018 FINANCIAL REPORT
FINANCIAL SITUATION
2
Activity summary at December 31
12 months ending December 31
2018
2017
Changes
Key elements of the income statement
Sales revenue
€million
1,645.1
1,643.4
+0.1%
EBITDA
€million
225.4
256.2
-12.0%
EBITDA margin
%
13.7
15.6
-1.9 pt
Current operating profit (EBIT)
€million
135.6
171.4
-20.9%
Operating margin
%
8.2
10.4
-2.2 pts
Earnings attributable to holders of company equity
€million
92.1
108.0
-14.7%
Net earnings per share
€
1.73
2.04
-17.9%
Key elements of the cash flow statement
Operating cash flow
€million
194.9
203.8
-€8.9 million
Net CAPEX
€million
-131.3
-140.1
-€8.8 million
Free cash flow*
€million
57.3
46.3
+€11.0 million
Key elements of the financial structure
Net debt
€million
339.3
300.2
+€39.1 million
Ratio of net debt to equity
36.0%
33.4%
+2.6 pts
* Free Cash Flow: operating cash flowminus net capital expenditure and changes in working capital requirements.
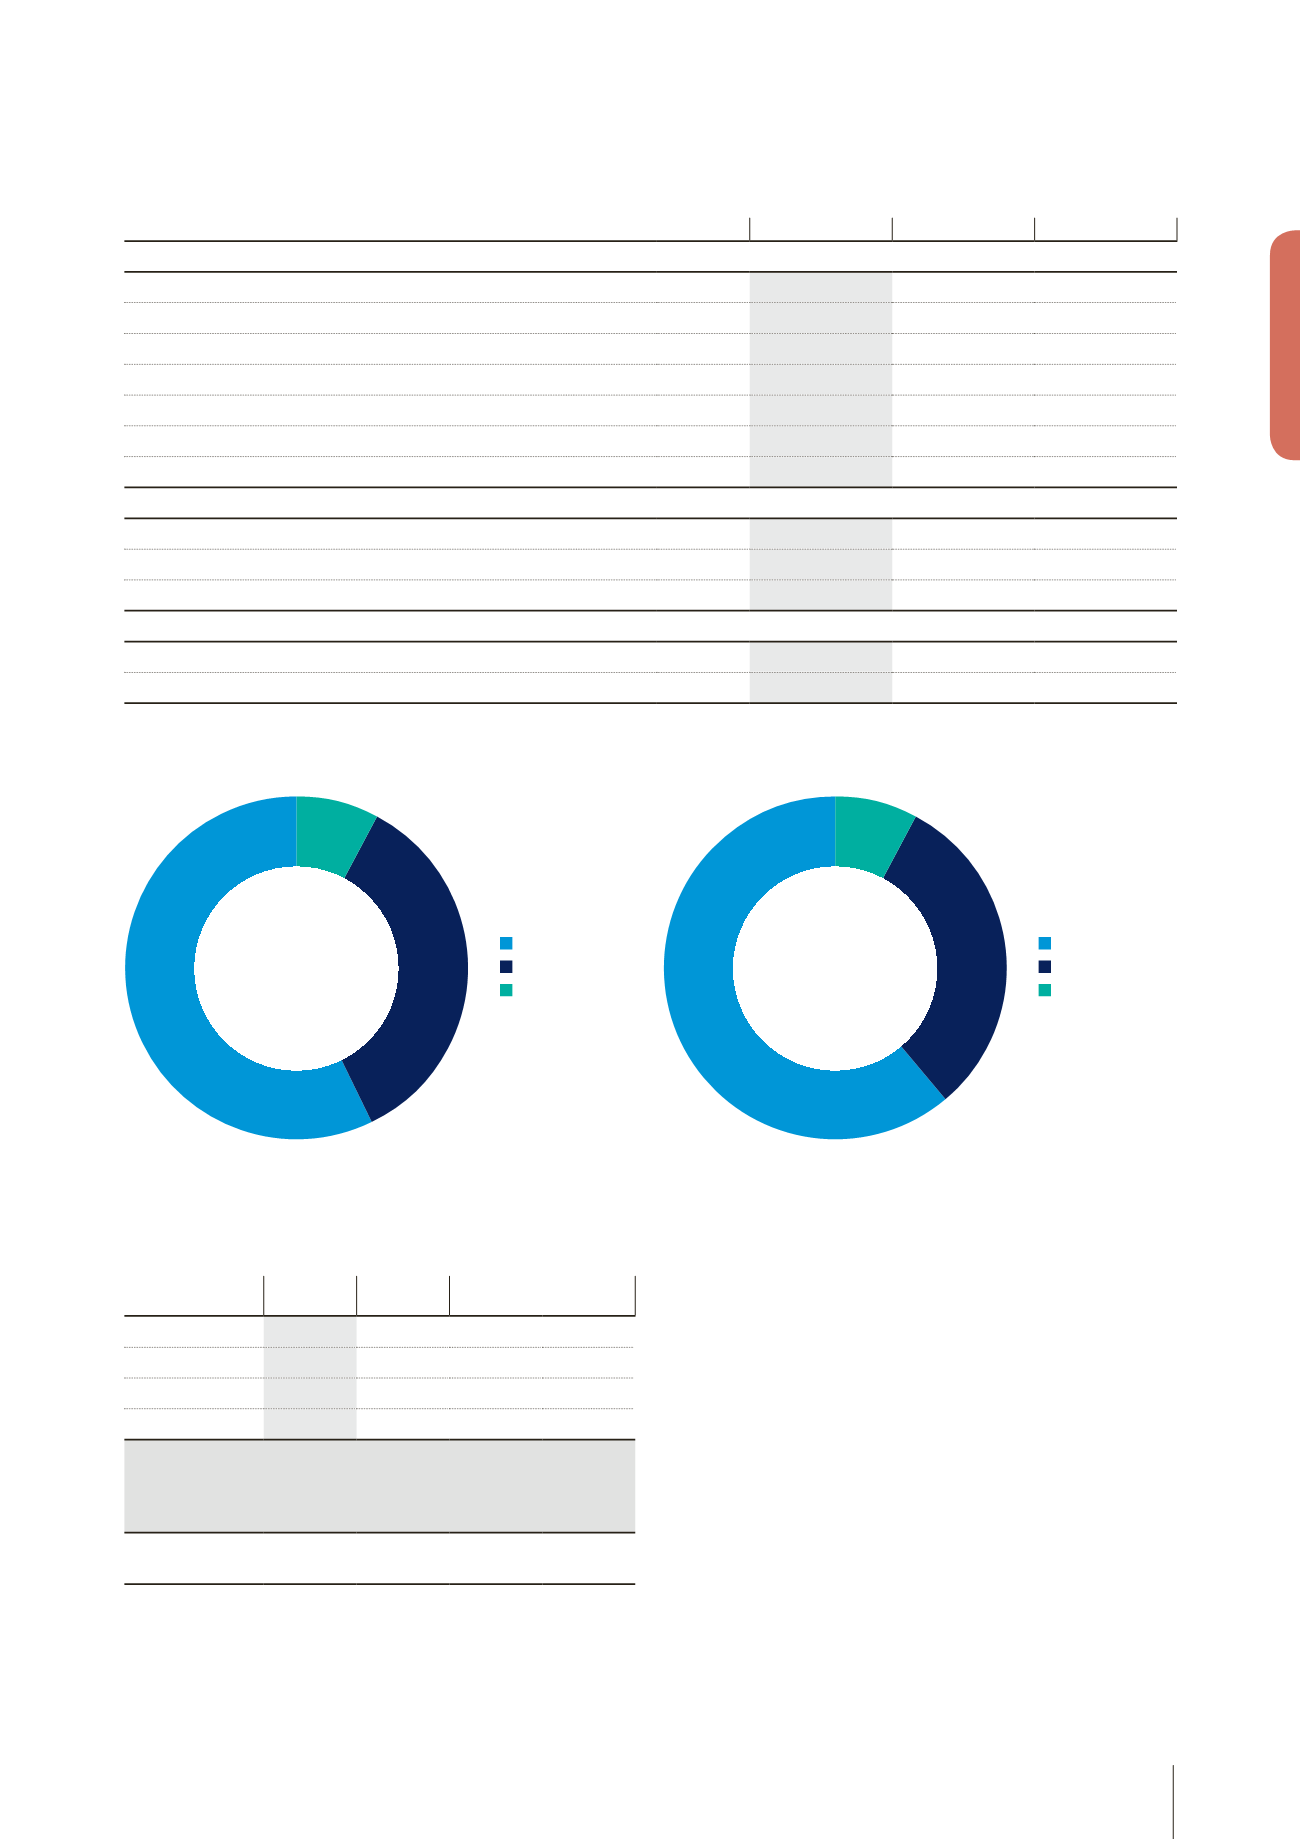
Breakdown of 2018 sales revenue
Breakdown of 2017 sales revenue
LISIAEROSPACE
LISIAUTOMOTIVE
LISIMEDICAL
8%
35%
57%
LISIAEROSPACE
LISIAUTOMOTIVE
LISIMEDICAL
8%
31%
61%
Headcount at the end of December
As at December 31, 2018, the LISI Group employed 12,131 employees, an
increase of the total workforce of 173 people (including 131 people at
Hi-Vol), which represents an increase of +1.4%compared to 2017.
Registered
headcount
2018
2017 DIFFERENCE N/N-1
LISI AEROSPACE
7,214
7,251
-37
-0.5%
LISI AUTOMOTIVE
3,931
3,773
+158
+4.2%
LISI MEDICAL
959
909
+50
+5.2%
LISI Holding
27
25
+2
+7.4%
Group total
(excluding
temporary
workers)
12,131
11,958
+173
+1.4%
Temporary
workers
746
1,159
2018 Results
Current operating profit dropped by nearly 21%. The operating margin
lost 2.2 points, ending the year at 8.2%.
The adjustment measures aimed at adapting the cost structure to the
significant fluctuations in business only began to bear fruit at the end of
theyear,first inthe“FastenersEurope”activityoftheAerospacedivision,
then in the Automotive division.
The EBITDA thus decreased by 12.0%to€225.4million (i.e. 13.7%of sales
revenue), due to:
■■
the difference between the increase in payroll over the full year and the
adjustment measures established at year-end in response to the drop
in activity for “Fasteners Europe” in aerospace, and in an even more
pronounced fashion in the automotive division. The ratio of payroll to
sales revenue rose by 1.2 points;
■■
the increase in the cost of raw materials in the Automotive division
amounting to €3.5 million.