


 80 / 168

80
2.3
I
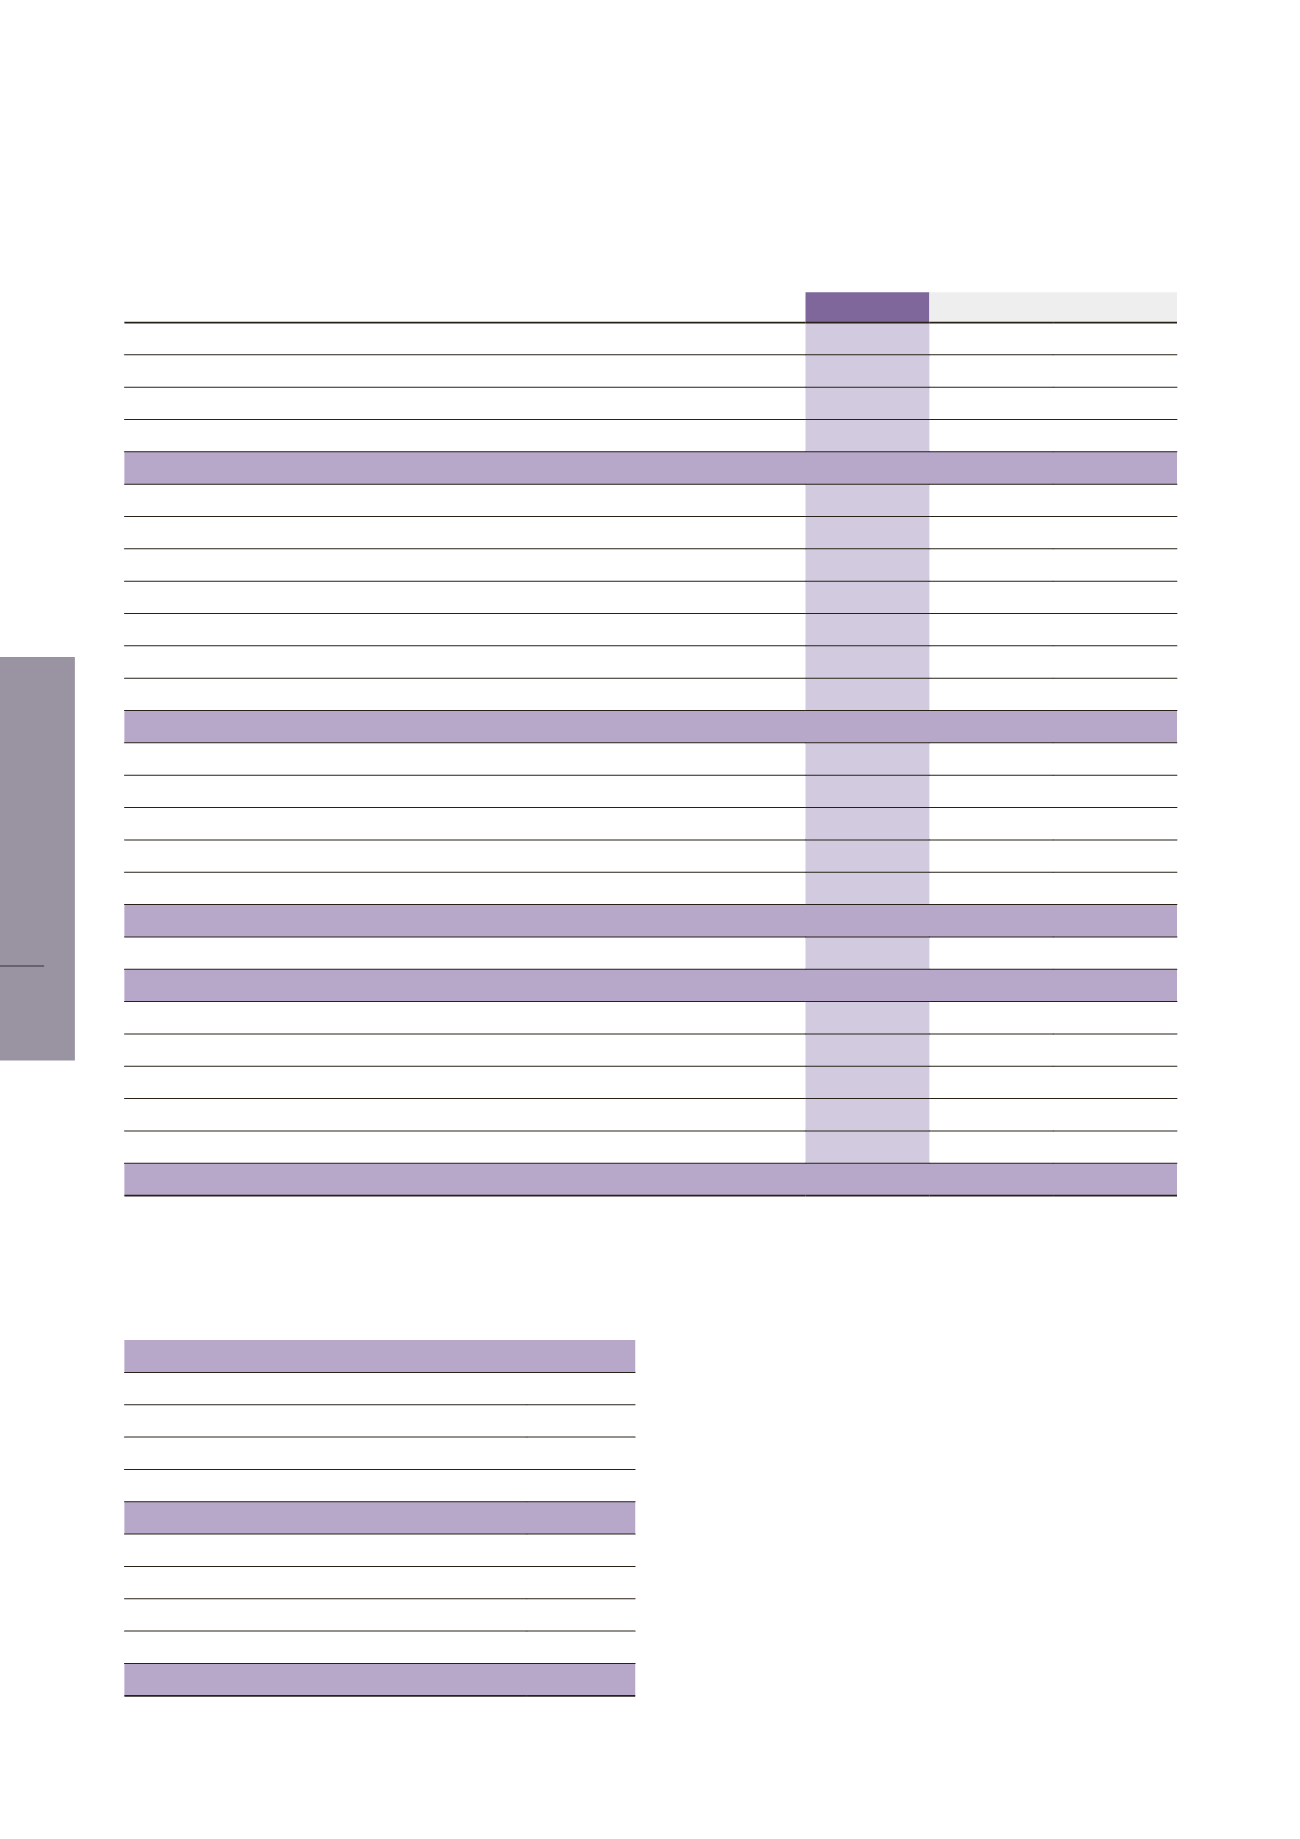
STATEMENT OF CASH FLOWS
(in thousands of euros)
2017
2016
2015
Operating activities
Operating cash flow
25,622
33,630
29,402
Effect of changes in inventory on cash
Effect of changes in accounts receivable and accounts payable
(32,546)
17,433
(10,765)
Cash provided by or used for operations (A)
(6,924)
51,063
18,638
Investment operations
Cash used to acquire tangible and intangible fixed assets
(1,474)
(205)
(147)
Cash received from the disposal of tangible and intangible fixed assets
489
100
32
Cash used to acquire financial assets
Cash received from the disposal of financial assets
Net cash used for acquisitions and disposals of subsidiaries
Cash payments and collections from loans to subsidiaries
(48,938)
(45,455)
2,000
Cash provided by or used for investing activities (B)
(49,923)
(45,560)
1,885
Financing operations
Cash received from shareholders as part of a capital increase
Dividends paid to shareholders of the parent company
(23,872)
(20,629)
(19,467)
Cash received from new loans
119,836
129,323
40,526
Repayment of loans
(42,671)
(70,026)
(46,434)
Cash provided by or used for financing activities (C)
53,293
38,668
(25,375)
Effect of change in foreign exchange rates (D)
Changes in cash (A+B+C+D)*
(3,554)
44,171
(4,853)
Cash at January 1 (E)
303,501
259,330
264,183
Cash at December 31 (A+B+C+D+E)
299,947
303,501
259,330
Marketable securities
133,194
101,350
75,859
Cash, subsidiaries’ current accounts
437,558
422,158
438,957
Banking facilities, subsidiaries’ current accounts
(270,805)
(220,007)
(255,486)
Closing cash position**
299,947
303,501
259,330
* The overall change in cash position corresponds to the total of net cash flows generated by the various categories: operations, CAPEX, and financing.
** The cash position is the algebraic sum of the balance sheet assets and liabilities.
2.4
I
CHANGE IN SHAREHOLDERS’ EQUITY
(in thousands of euros)
At 12/31/2015
198,261
Profit (loss) for the period
30,037
Capital increase
Dividends paid
(19,467)
Accelerated depreciation
5
At 12/31/2016
221,223
Profit (loss) for the period
20,111
Capital increase
Dividends paid
(23,872)
Accelerated depreciation
(26)
At 12/31/2017
217,488
LISI 2017 FINANCIAL REPORT
COMPANY FINANCIAL STATEMENTS
4