


 67 / 168

2.6.9
I
Earnings per share
Earnings per share calculations are shown in paragraph 2.2.1.8.6.
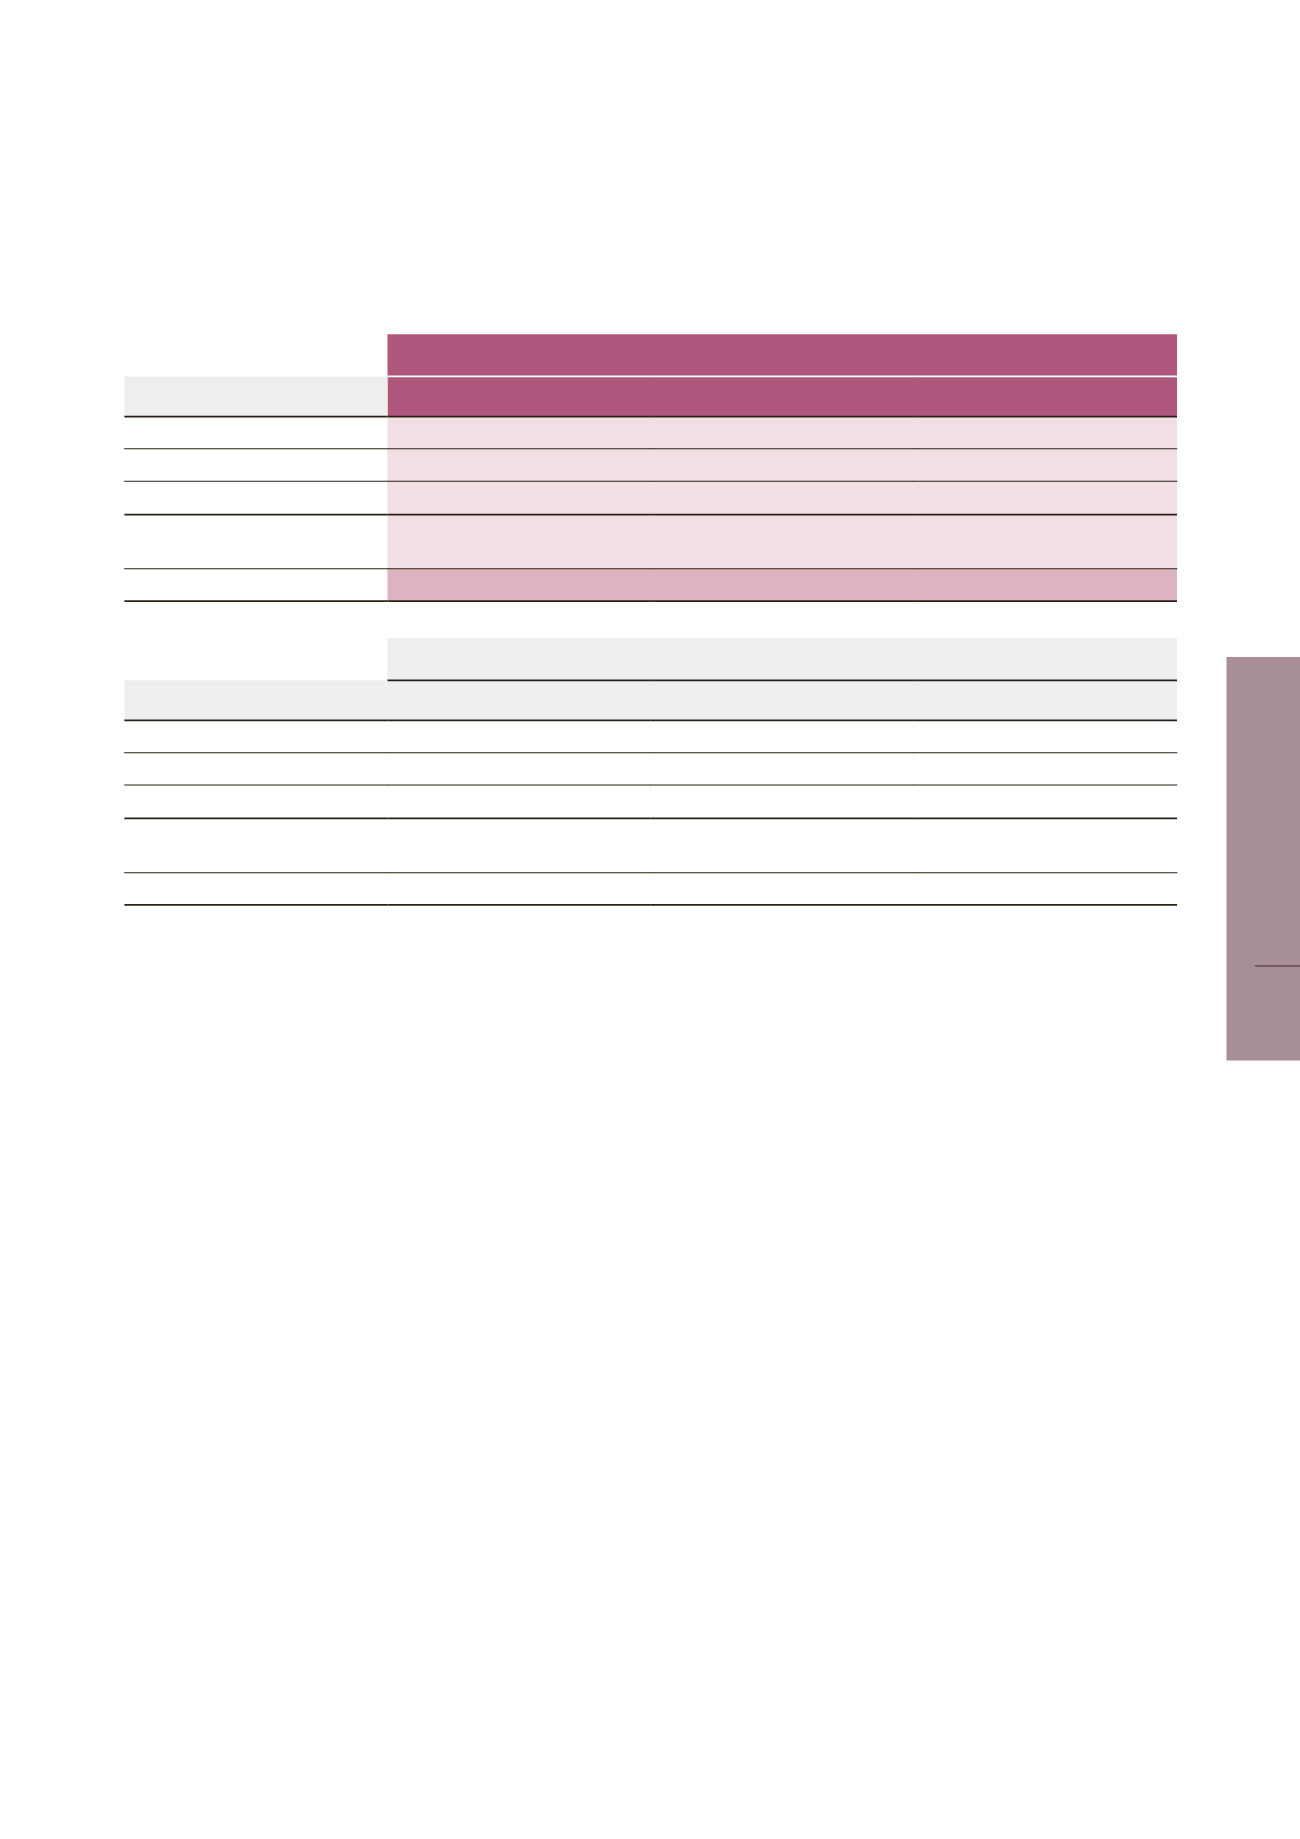
The tables below indicate the reconciliation between the non-diluted and the diluted earnings per share.
12/31/2017
(in €’000)
Profit (loss) for the period
Number of shares
Net earnings per share in €
Total shares
54,023,875
Treasury shares
(976,887)
BASIC EARNINGS PER SHARE
107,965
53,046,988
2.04
Restatement of performance
shares being awarded
454,250
DILUTED EARNINGS PER SHARE
107,965
53,501,238
2.02
12/31/2016
(in €’000)
Profit (loss) for the period
Number of shares
Net earnings per share in €
Total shares
54,023,875
Treasury shares
(1,119,422)
BASIC EARNINGS PER SHARE
107,008
52,904,453
2.02
Restatement of performance
shares being awarded
473,210
DILUTED EARNINGS PER SHARE
107,008
53,377,663
2.00
2.7
I
ADDITIONAL INFORMATION
2.7.1
I
Segment information
The Group’s business is broken down between three markets that include the following three operational sectors (divisions):
–
–
The LISI AEROSPACE division, which brings together all activities in the aerospace market,
–
–
The LISI AUTOMOTIVE division, which brings together all activities in the automotive market,
–
–
The LISI MEDICAL division, which brings together all activities in the medical market.
The “Others” heading mainly consists of the holding company LISI S.A. and disposals.
67
LISI 2017 FINANCIAL REPORT
CONSOLIDATED FINANCIAL STATEMENTS
3