LISI ANNUAL REPORT 2009
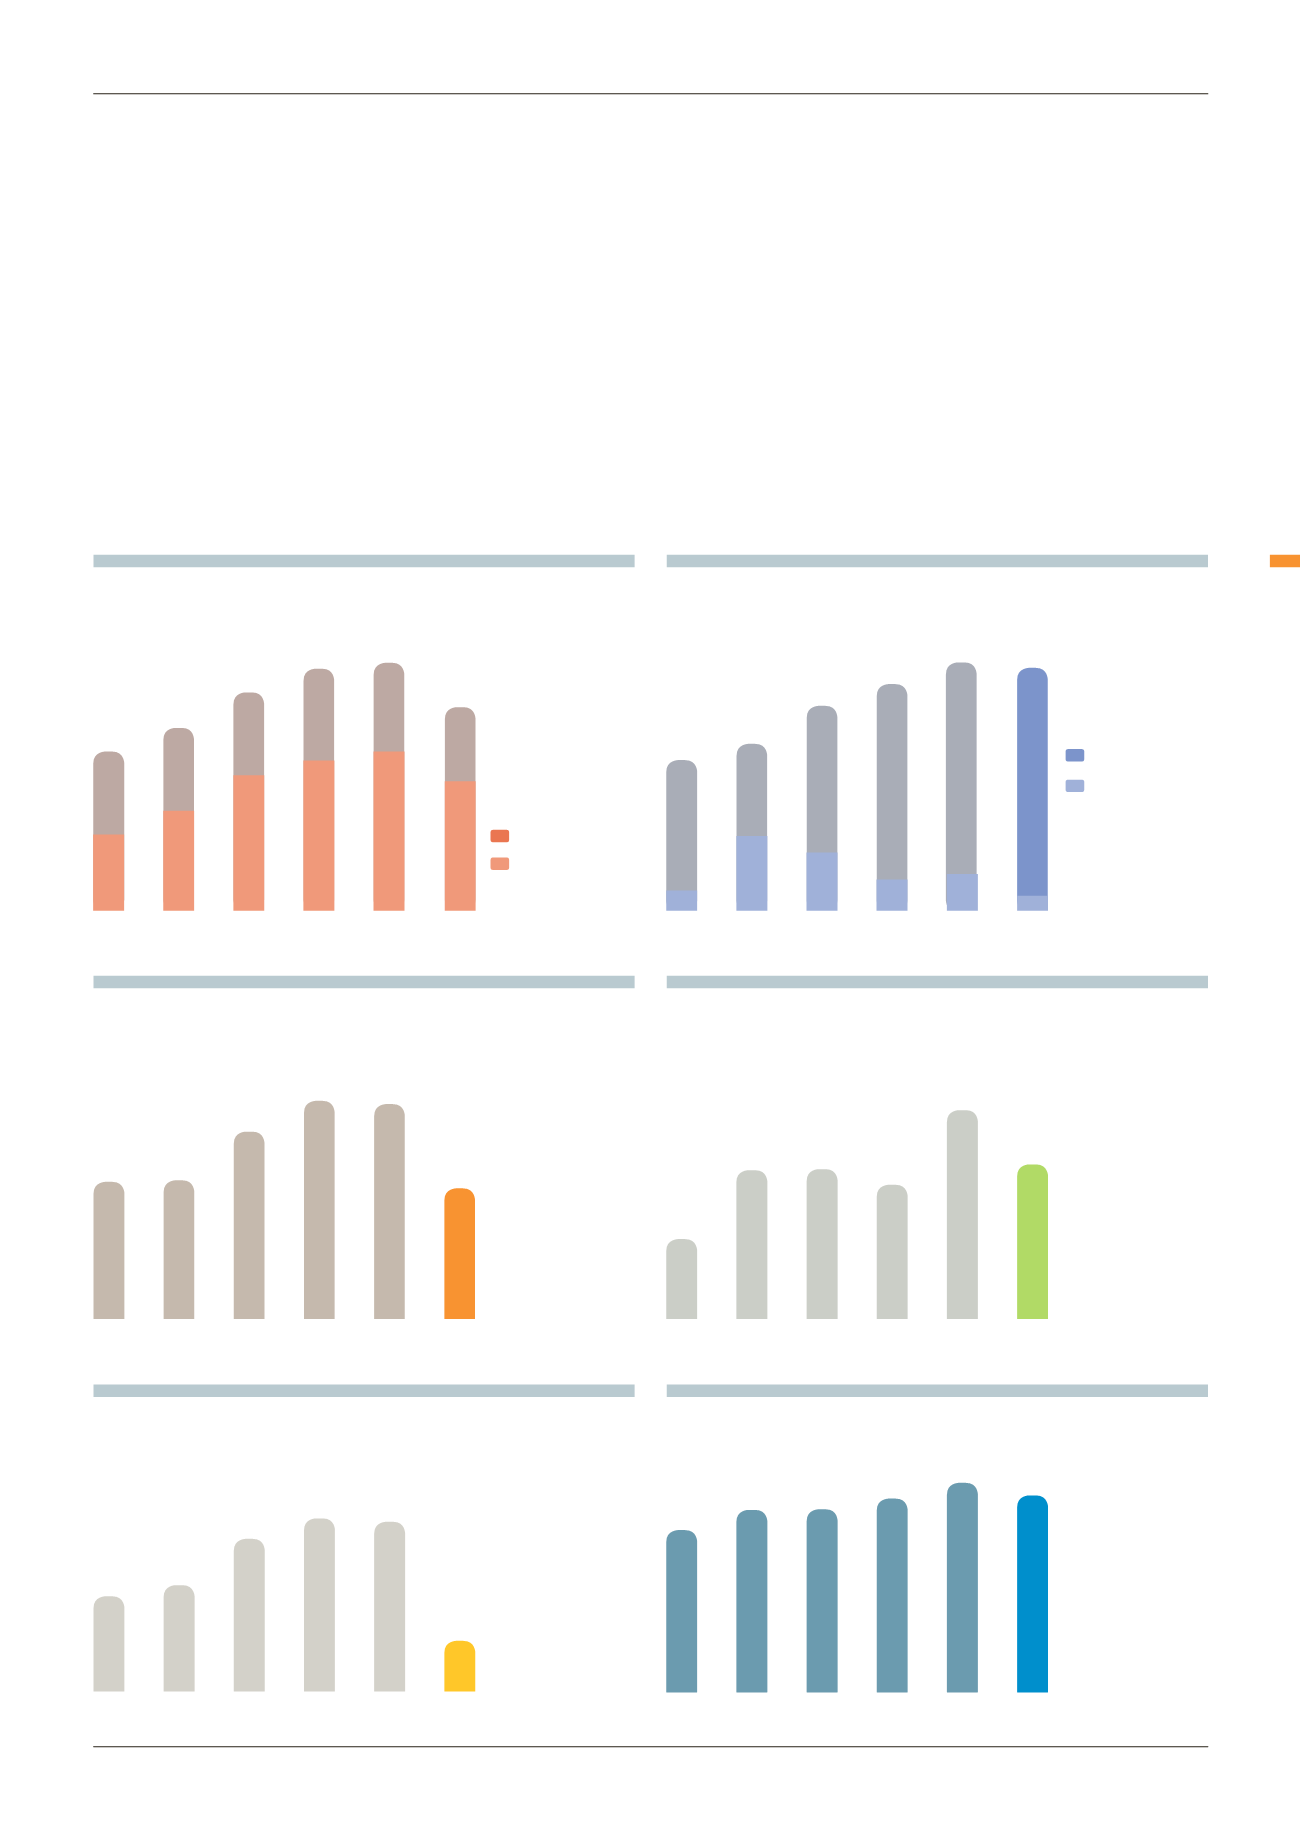
EBITDA IN €M AND IN % OF SALES
EQUITY CAPITAL AND NET FINANCIAL DEBT IN €
WORKFORCE
(registered)
CONSOLIDATED SALES IN €M
EBIT IN €M AND IN % OF SALES
NET CAPITAL EXPENDITURE IN €M
AND IN % OF SALES
2009
key figures
6,144
5,515
6,161
6,512
7,068
6,596
92.9
15.0%
91.7
16.9%
122.3
16.5%
141.9
17.4%
141.0
16.7%
87.8
12.6 %
2004
2005
2006
2007
2009
2008
740
457
816
512
844
543
618
339
541
263
442
695
Total sales
Sales out of
France
2004
2005
2006
2007
2009
2008
63.8
10.3%
58.4
10.8%
88.6
12.0%
100.1
12.6%
98.9
11.7%
34.2
4.9%
2004
2005
2006
2007
2009
2008
47.3
7.7%
27.0
5.0%
47.6
6.4%
43.1
5.3%
65.2
7.7%
49.0
7.1%
2004
2005
2006
2007
2009
2008
2004
2005
2006
2007
2009
2008
425
310
136
357
106
458
69
277
37
450
28
Equity
Net financial
debt
2004
2005
2006
2007
2009
2008
53
7


