


 56 / 168

2.5.2.3 Cash and cash equivalents
The cash available as at December 31, 2017 stood at €197.6 million,
compared to €141.7 million in 2016. This item consists mainly of
investment securities held by the Group and in particular monetary
Sicav instruments and negotiable security deposits in the amount
of €125.3 million and current bank accounts in euros and foreign
currencies. The latter are recorded at their fair value, and value
adjustments are recorded into the income statement. These positions
are not exposed, the main backing instruments guaranteeing the
capital.
2.5.3
I
Shareholders’ equity
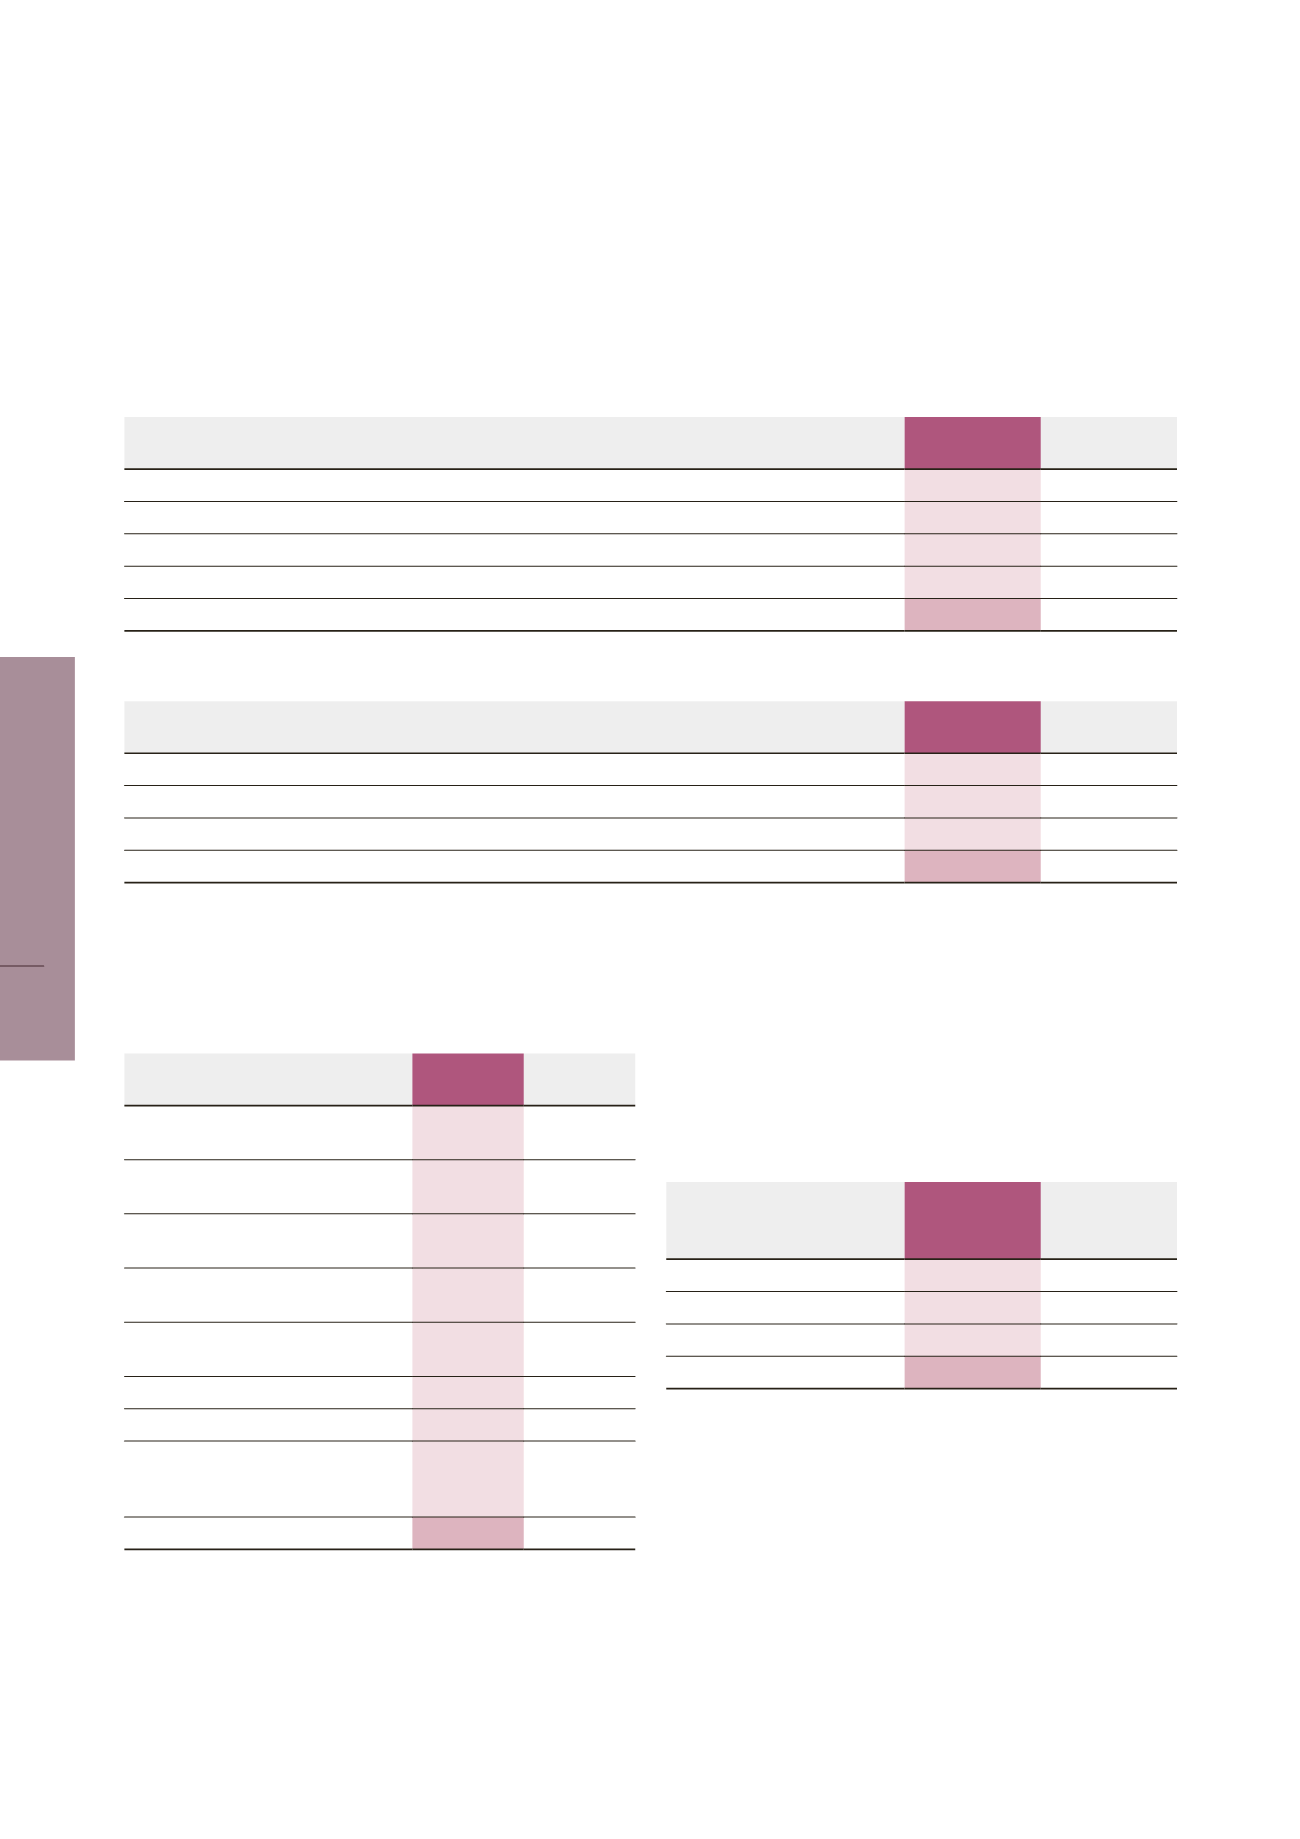
TheGroup’sshareholders’equitystoodat€890millionatDecember31,2017,
against €860.3 million at December 31, 2016, being an increase of €29.7
million. This change takes into account the followingmain factors:
CHANGES IN € MILLION
12/31/2017
12/31/2016
Income for the period attributable to
equity holders of parent,
108.0
107.0
Distribution of dividends paid in May
2017,
(23.9)
(20.6)
Treasury shares and payments in
shares,
2.1
1.8
Actuarial gains and losses on
employee benefits,
0.4
(3.5)
Fair value of cash flow hedging
instruments,
18.3
(9.0)
Change in consolidation scope
(57.2)
Miscellaneous restatements,
1.3
(4.9)
Translation differences related to
changes in the closing rate, including
the revaluation of the dollar
(19.3)
(2.9)
TOTAL
29.7
68.0
The €57.2million change in scope can be explained by the recognition of
a financial debt of €70.7million, whichwas offset byminority interests of
€13.5 million and by Group shareholders’ equity of €-57.2 million so that
the two-stage structuring of the acquisition of the Termax Group could
be taken into account.
2.5.3.1 Share capital
Share capital at year-end stands at €21,609,550, broken down into
54,023,875 issued shares with a face value of €0.40.
2.5.3.2 Additional paid-in capital
This is due to the capital increase operation reserved for employees:
BREAKDOWN OF ADDITIONAL
PAID-IN CAPITAL
(in thousands of euros)
12/31/2017
12/31/2016
Additional paid-in capital
54,843
54,843
Contribution premiums
15,030
15,030
Merger premiums
2,711
2,711
TOTAL
72,584
72,584
2.5.3.3 Capital management
The Group’s policy consists inmaintaining robust capital so as to support a
highly capitalistic business, preserve the confidence of shareholders and
investors, support growth and withstand periods of recession. The Board
of Directors is particularly attentive to capital returns and the dividends
paid to shareholders.
The impact of the change in working capital on cash is as follows:
(in €’000)
2017
2016
Effect of the change in inventories
67
2,504
Effect of the change in cash flow imbalances of customers and other debtors
7,943
(36,011)
Effect of the change in cash flow imbalances of suppliers and other creditors
10,030
12,282
Effect of the change in cash flow imbalances for taxes
(35,451)
18,578
CHANGE IN WORKING CAPITAL REQUIREMENTS
(17,411)
(2,647)
The free cash flow broke down as follows:
(in €’000)
2017
2016
Operating cash flow
203,838
195,805
Net CAPEX
(140,146)
(119,614)
Change in working capital requirements
(17,411)
(2,647)
FREE CASH FLOW
46,281
73,544
56
LISI 2017 FINANCIAL REPORT
CONSOLIDATED FINANCIAL STATEMENTS
3