


 45 / 168

Trade and other receivables
Group exposure to credit risk is mainly influenced by individual
customer profiles. The Group has a policy of monitoring trade
receivables, allowing it to constantly control its third party risk
exposure. The Group believes that the credit risk of write-off of past
due receivables is minimal.
At December 31, 2017 the amount of provisions for doubtful debts
amounted to €3.7 million, to be compared to total receivables of
€204.3 million. The amount of the permanent losses recognized over
the year was €1.0 million.
Risk on investment securities
On December 31, 2017, the Group’s balance sheet showed cash
and cash equivalents of €197.6 million (see §2.6.2.3 Cash and cash
equivalents). The cash equivalents are mainly made of marketable
securities represented by monetary mutual funds, invested in very
short maturity securities and representing no risk in capital, in
accordance with the Group’s cash management policy. In accordance
with accounting principles, these investments are valued at their
market price at year-end.
2.4.2
I
Liquidity risk
The Group’s cash management is centralized: the vast majority of
the cash surpluses or financing requirements of its subsidiaries,
where local legislation permits, is invested or financed by the parent
company on normal market terms. The central cash management
team manages the financing of the Group, current and forecast, and
ensures its capacity to meet its financial commitments. For that
purpose, it maintains a level of the available cash and confirmed
credit facilities compatible with its size and the maturities of its debt.
As at December 31, 2017, the LISI Group had available unused bank
overdraft lines of €60 million, and net cash of €197.6 million, resulting
in a total operating cash flow of €257.6 million, making it insensitive
to liquidity risk.
The Groups financing contracts provide for compliance with two
main ratio restrictions:
–
–
Net debt/Consolidated shareholders’ equity < 1.2;
–
–
Net debt/Consolidated EBITDA < 3.5.
As at December 31, 2017, the former amounted to 0.337 and the
latter to 1.1717, compared with 0.254 and 0.9201, respectively, as at
December 31, 2016. The Group therefore has a comfortable margin of
safety, confirming its low liquidity risk.
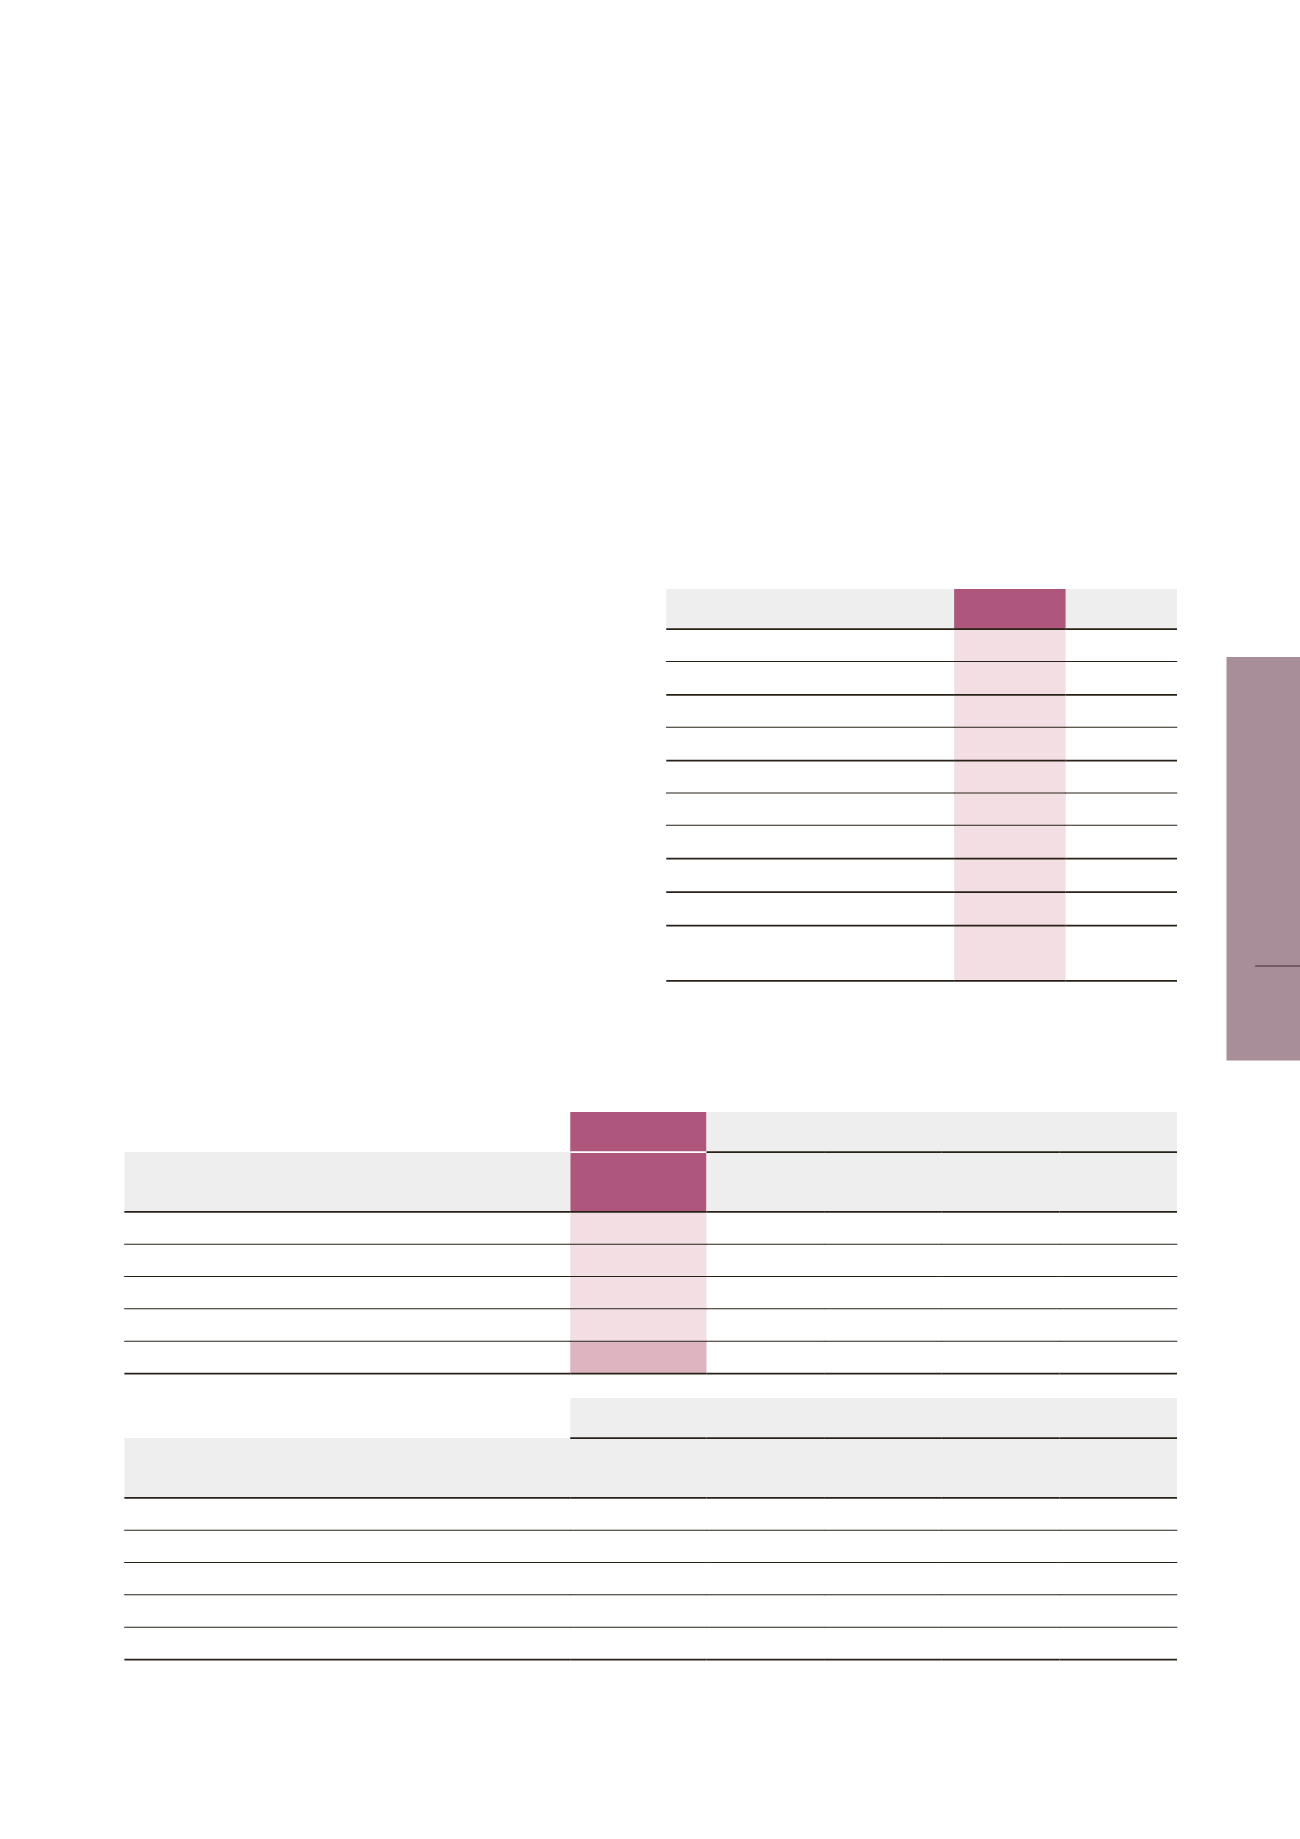
(in €’000)
12/31/2017
12/31/2016
Cash and cash equivalents
197,576
141,719
CASH AVAILABLE [A]
197,576
141,719
Current banking facilities [B]
16,440
15,984
NET CASH [A - B]
181,136
125,735
Credits
455,400
315,351
Other financial creditors
25,891
28,559
NET DEBT [C]
481,291
343,910
NET DEBT [D = C + A - B]
300,155
218,175
GROUP EQUITY [E]
890,001
860,258
DEBT RATIO (EXPRESSED AS %)
[D / E]
33.7% 25.4%
N.B.: 2015 debt ratio as a %: 19.8%.
The cash table for all financial liabilities is as follows:
At 12/31/2017
Breakdown of contractual flows not discounted on due date
FINANCIAL LIABILITIES RECORDED ON BALANCE SHEET
(in thousands of euros)
Net value
accounting
At less
than 1 year
Between
1 and 5 years
Over
5 years
Total
Non-current borrowings
317,757
260,338
57,419
317,757
Other non-current financial liabilities (excl. PCA)
4,678
4,678
4,678
Current borrowings
179,973
179,973
179,973
Trade and other accounts payable
297,109
297,109
297,109
TOTAL FINANCIAL LIABILITIES
799,517
477,082
265,016
57,419
799,517
At 12/31/2016
Breakdown of contractual flows not discounted on due date
FINANCIAL LIABILITIES RECORDED ON BALANCE SHEET
(in thousands of euros)
Net value
accounting
At less
than 1 year
Between
1 and 5 years
Over
5 years
Total
Non-current borrowings
253,856
92,449
161,407
253,856
Other non-current financial liabilities (excl. PCA)
5,365
5,365
5,365
Current borrowings
106,037
106,037
106,037
Trade and other accounts payable
304,492
304,492
304,492
TOTAL FINANCIAL LIABILITIES
669,750
410,529
97,814
161,407
669,750
45
LISI 2017 FINANCIAL REPORT
CONSOLIDATED FINANCIAL STATEMENTS
3