LISI 2012 FINANCIAL REPORT
50
3
Consolidated financial statements
2.5.1.3 INVESTMENTS
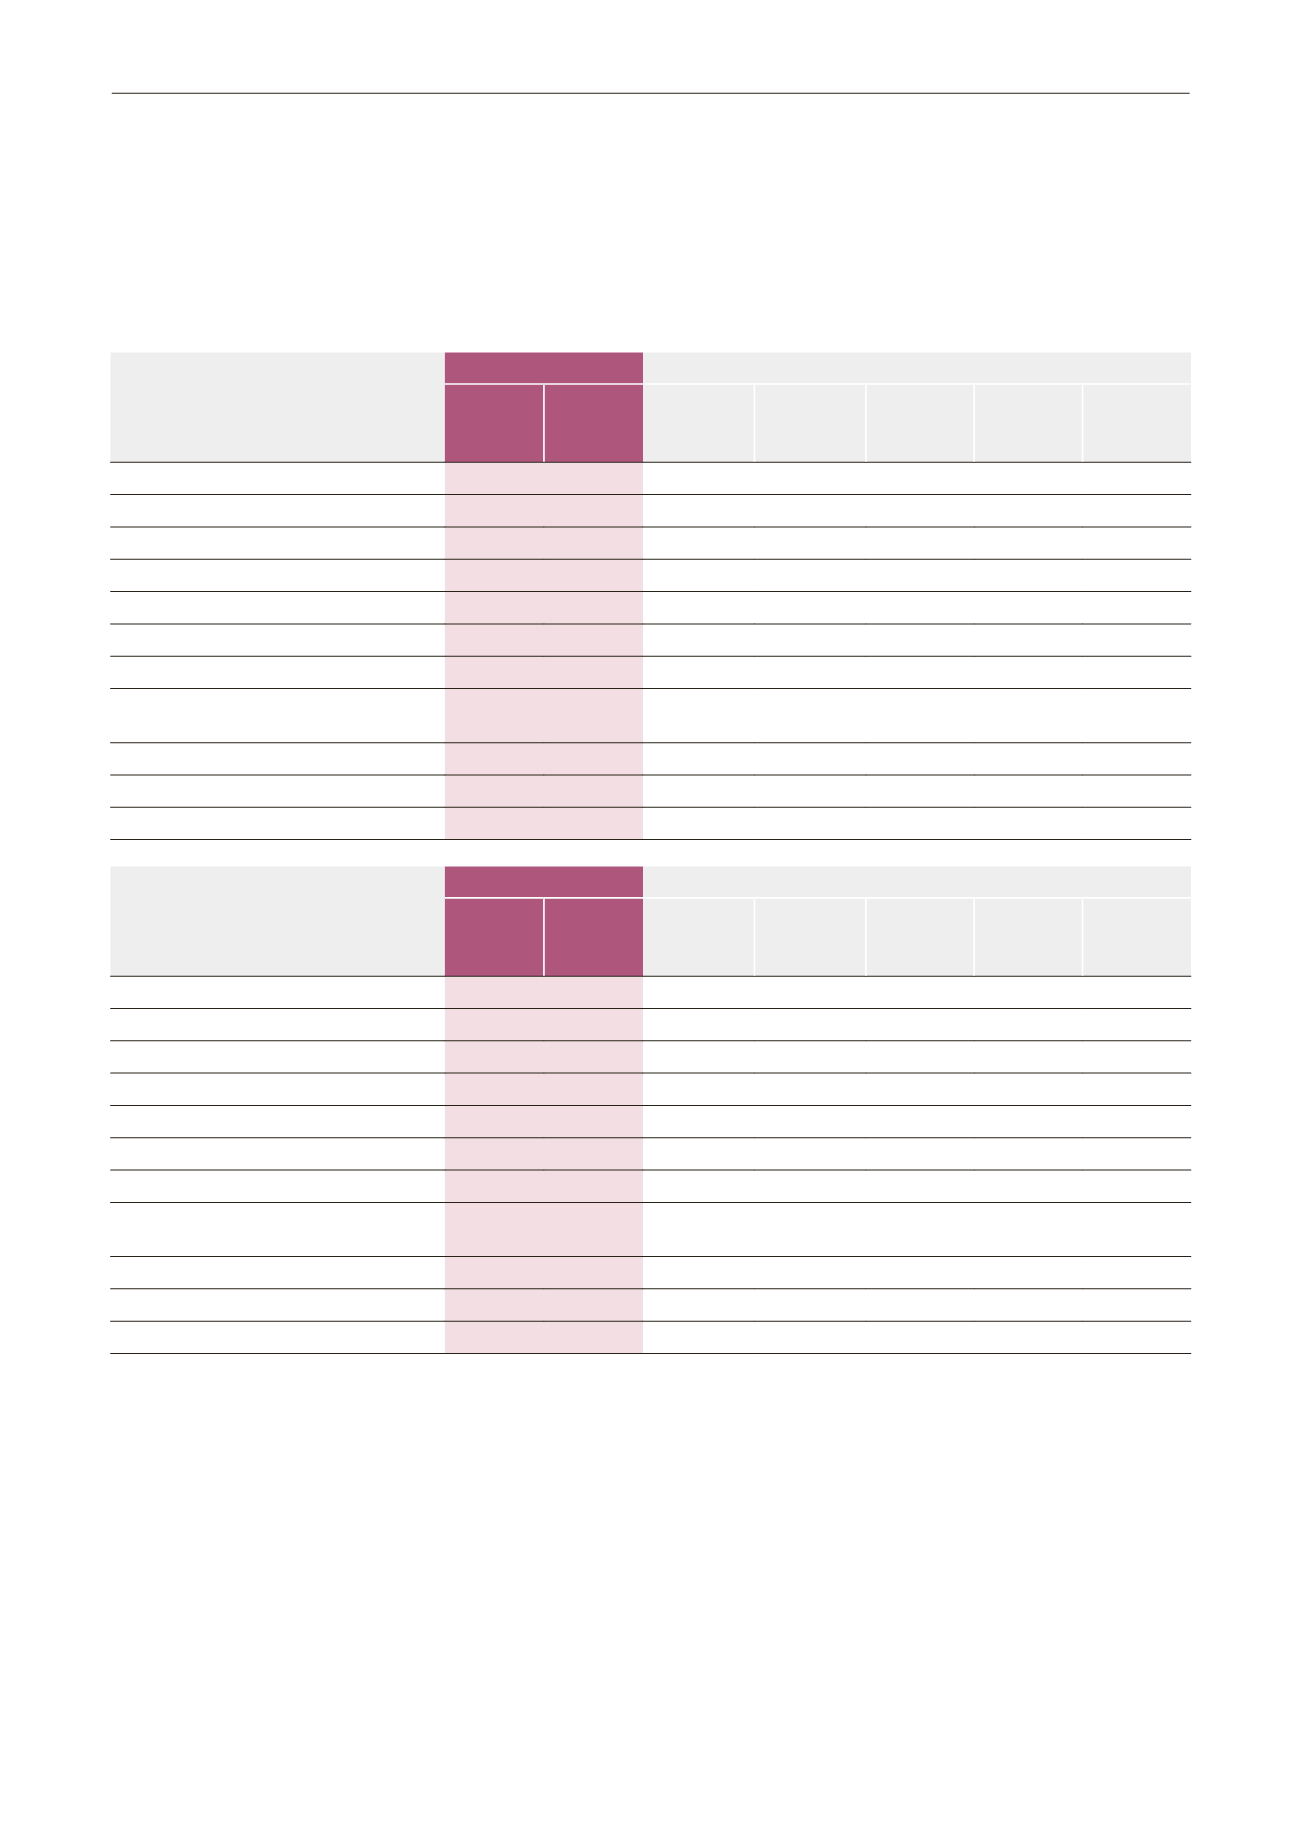
Financial assets and liabilities recorded on the balance sheet are broken down into the following accounting categories and classes
of financial instruments:
Financial assets and liabilities recorded
on balance sheet
(in €'000)
At 12/31/2012
Breakdown by instrument category
Net value Fair value
Fair value
via earnings
Assets
available
for sale
Loans and
receivables
Debt at
depreciated
cost
Instruments
derivatives
Long-term financial assets
5,977
5,977
5,977
Other long-term financial assets
937
937
937
Trade and other receivables
153,133 153,133
153,133
Short-term investments
71,535 71,535 67,542
3,993
Cash and cash equivalents
30,625 30,625 30,625
Total financial assets
262,207 262,207 98,167
160,047
3,993
Long-term borrowings
111,004 111,004
109,332
1,672
Other long-term financial liabilities
(excl. PCA)
5,218
5,218
5,218
Short-term borrowings
67,851 67,851
67,851
Trade and other accounts payable
188,093 188,093
188,093
Total financial liabilities
372,166 372,166
370,494
Financial assets and liabilities recorded
on balance sheet
(in €'000)
At 12/31/2011
Breakdown by instrument category
Net value Fair value
Fair value
via earnings
Assets
available
for sale
Loans and
receivables
Debt at
depreciated
cost
Instruments
derivatives
Long-term financial assets
5,642
5,642
5,642
Other long-term financial assets
24
24
24
Trade and other receivables
158,847 158,847
158,847
Short-term investments
51,882 51,882 50,605
1,277
Cash and cash equivalents
45,675 45,675 45,675
Total financial assets
262,070 262,070 96,304
164,489
1,277
Long-term borrowings
136,408 136,408
1,062
135,346
Other long-term financial liabilities
(excl. PCA)
4,237
4,237
4,237
Short-term borrowings
63,788 63,788
63,788
Trade and other accounts payable
194,711 194,711
194,711
Total financial liabilities
399,144 399,144
1,062
398,082


