LISI 2012 FINANCIAL REPORT
44
3
Consolidated financial statements
requirements. At December 31, 2012, the LISI Group had
several confirmed, unused medium-term bank credits for a
total amount of €31 million. At December 31, 2012, the Group
also had unused overdrafts amounting to €56 million. If one
integrates these amounts to net cash of €91m, the LISI Group
had €178million as at December 31, 2012. Therefore, the Group
considers its risk of liquidity to be low at December 31, 2012.
The ratio of net debt to equity stood at 13.3% at December 31,
2012 against 19% at December 31, 2011, 1, as indicated below.
At 13.3% at December 31, 2012, the net debt to equity ratio
was far below 120%, a limit that would be likely, according to
certain bank covenants, to lead to the early repayment of past
drawdowns.
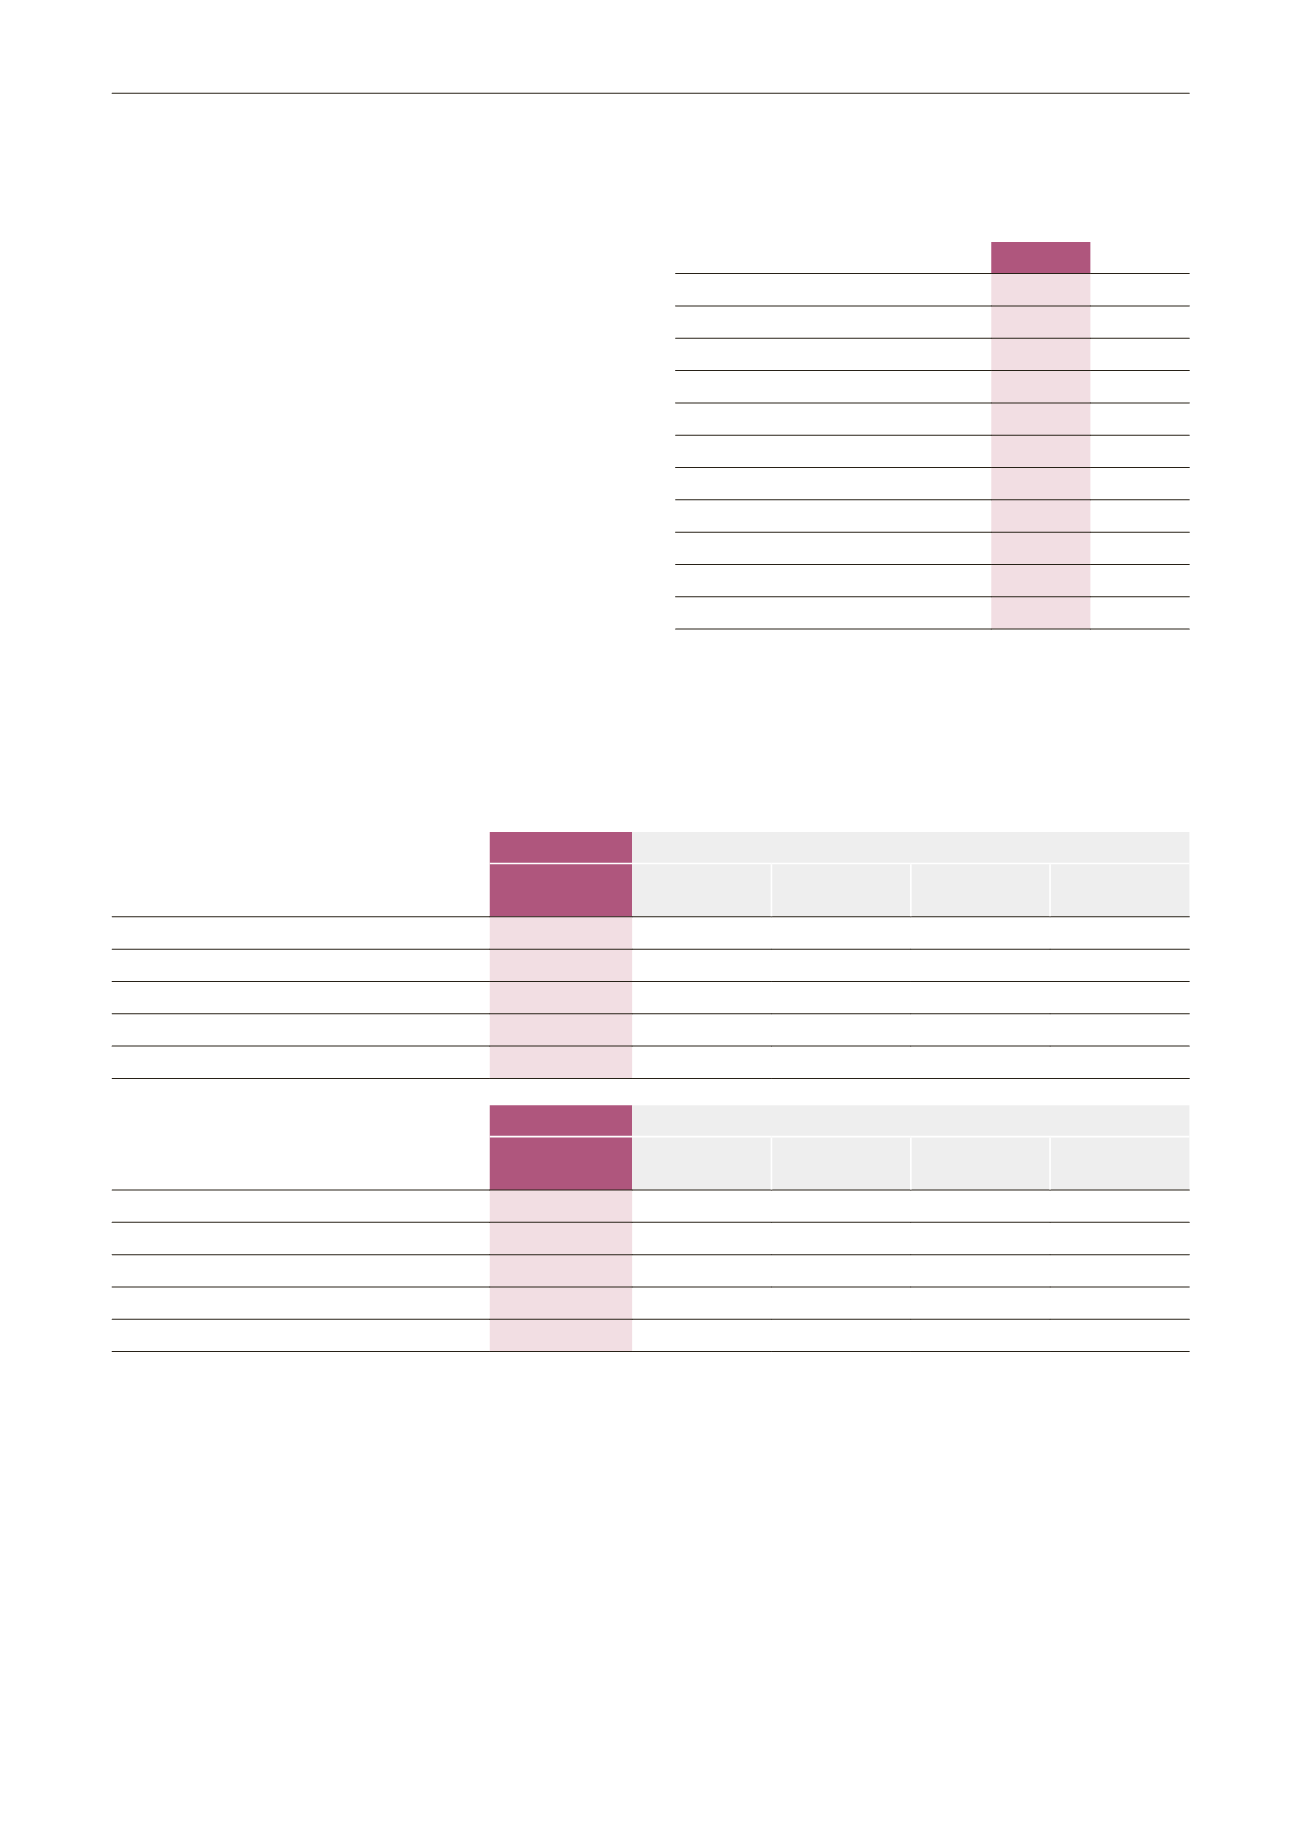
(in €'000)
12/31/2012
12/31/2011
Other short-term financial assets
71,535 51,882
Cash and cash equivalents
30,625 45,675
Cash available [A]
102,160 97,557
Short-term banking facilities [B]
10,892 29,565
Net cash [A - B]
91,268 67,992
Credits
148,644 149,552
Other financial creditors
19,320 21,079
Debt [C]
167,964 170,631
Net debt [D = C + A - B]
76,696 102,638
Group equity [E] *
574,657 537,232
Debt ratio (expressed as %) [D / E]
13,3% 19,1%
* The group has opted for early application as of January 1, 2012 of the revised
IAS 19; therefore, the financial statements for fiscal 2011 have been restated
in accordance with the new rules for comparison purposes.
N. B.: 2010 reminder of the debt ratio as a %: 3.6%
The cash table for all financial liabilities is as follows:
Financial liabilities recorded on balance sheet
(in €'000)
At 12/31/2012
Breakdown of contractual flows not discounted on due date
Net value
Within less
than one year
Between 1
and 5 years
Over 5 years
Total
Long-term borrowings
111,004
106,981
4,023
111,004
Other long-term financial liabilities (excl. PCA)
5,218
5,071
147
5,218
Short-term borrowings
67,851
67,851
67,851
Trade and other accounts payable
188,093
188,093
188,093
Total financial liabilities
372,166
255,944
112,052
4,170
372,166
Financial liabilities recorded on balance sheet
(in €'000)
Au 12/31/2011
Ventilation des flux contractuels non actualisés par échéance
Net value
Within less
than one year
Between 1
and 5 years
Over 5 years
Total
Long-term borrowings
136,408
128,214
8,194
136,408
Other long-term financial liabilities (excl. PCA)
4,237
4,091
146
4,237
Short-term borrowings
63,788
63,788
63,788
Trade and other accounts payable
194,711
194,711
194,711
Total financial liabilities
399,144
258,499
132,305
8,340
399,144
Market risk
Market risk is the risk of variation in market prices, such as
interest rates, affecting the Group result or the value of
financial instruments held. Managing market risk involves
controlling market risk and maintaining it within acceptable
limits, whilst optimizing the profitability: risk ratio.
The Group buys and sells derivatives and supports financial
liabilities in order to manage market risk.
Hedging and market transactions on interest rates, exchange
rates or securities using futures instruments are recorded
in accordance with the provisions of CRBF rules nos. 88-02
and 90-15. Commitments relating to these transactions are
posted to off-balance sheet accounts for the nominal value
of the contracts. As at December 31, 2012, the sum of these
commitments represented the volume of transactions that
remained unsettled at year-end.
The accounting principles applied vary according to the nature
of the instruments and the operator’s initial intentions.
The commitments are detailed in paragraph 2.7.4.1 of this
annual report.


