LISI 2012 FINANCIAL REPORT
120
7
Information regarding the Company and corporate governance
2.6 Independent directors and
directors linked to the company
As per the principles advocated by the AFEP/MEDEF code,
the directors of the LISI Group SA are qualified independent
directors when their status meets the following six criteria:
- not being an employee or corporate officer of the company,
not being an employee or director of the parent company or
of a company that it consolidates and not having held such
status for the previous five years;
- not being a corporate officer of a company in which the
company directly or indirectly holds a director's mandate or in
which an employee designated as such or a corporate officer
(current or having been so for less than five years) holds a
director's mandate;
- not being a major client, supplier, investment banker or
financial banker significant for the company or its group, or for
whom the company or its group represents a major portion
of business;
- not being a close relative of a corporate officer;
- not having been a company auditor for the previous five years;
- not having been a company director for more than twelve
years.
In concrete terms, holders of the role of independent director
are people who are not linked directly or indirectly to the
reference shareholders which are CIKO, FFP and VIELLARD
MIGEON & CIE (details in paragraph 2.8.1 of this document).
2.7 Employees
2.7.1 Head count
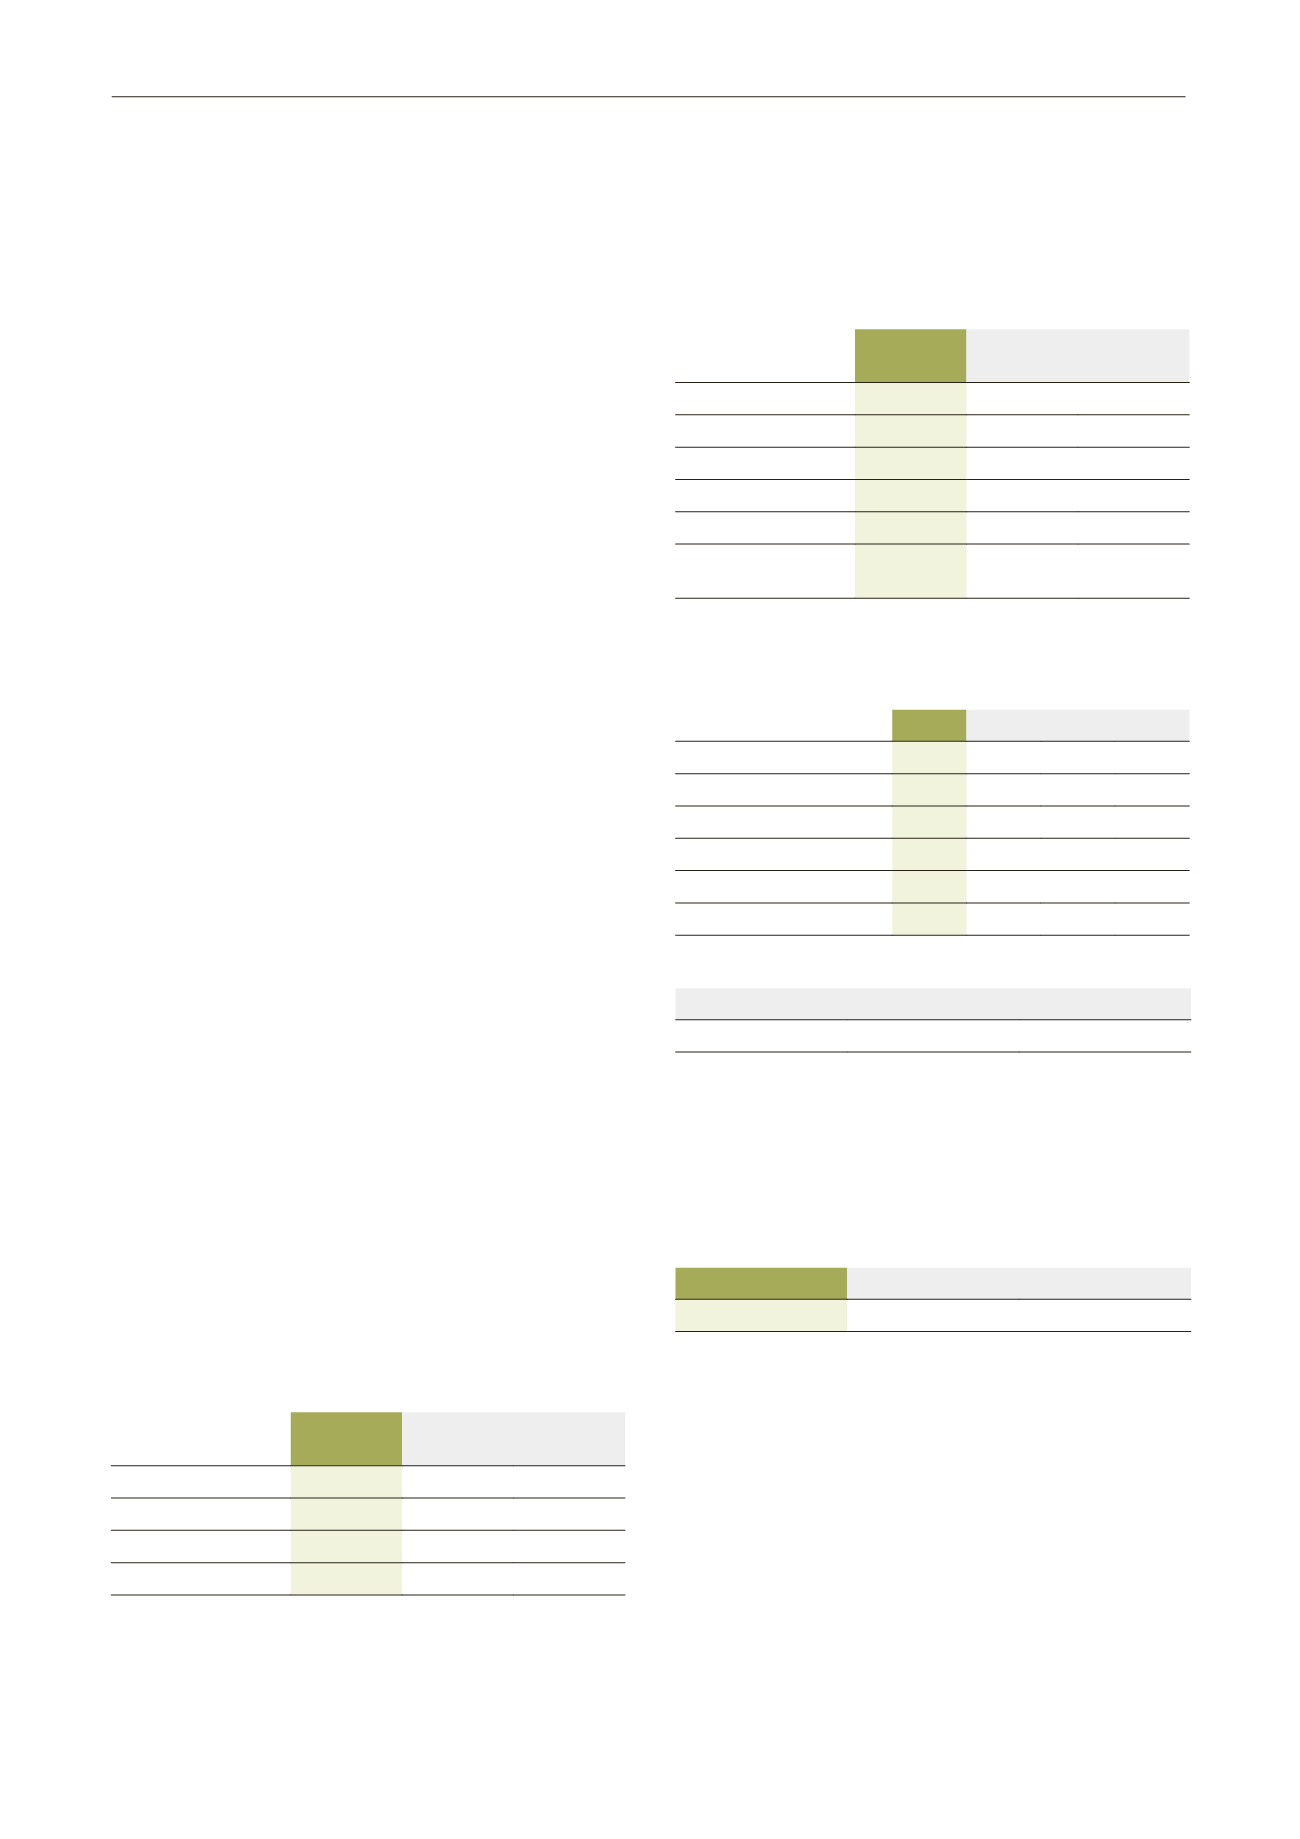
2.7.1.1 Registered employees at period end by category
The table below shows the breakdown of Group staff by
category:
2012
2011 Difference
N/N-1
Management
802
761
5.4%
Supervisors
747
822
-9.1%
Staff and workers
7,360
6,929
6.2%
Total
8,909
8,512
4.7%
2.7.1.2 Registered employees at period end by division
The table below shows a breakdown of Group staff by business
activity:
2011
2010 Difference
N/N-1
LISI AEROSPACE
5,205
4,677
11.3%
LISI MEDICAL
475
508
-6.5%
LISI AUTOMOTIVE
3,213
3 312
-3.0%
Holding company
16
15
6.7%
Total
8,909
8,512
4.7%
Temporary staff
engaged
563
627
-10.2%
2.7.1.3 Geographic breakdown of staff
The table below shows the breakdown of staff by geographic
area:
2011
as a % 2010 as a %
France
4,840 54% 4,727 56%
Europe (excl. France)
1,640 18% 1,638 19%
North American continent 1,457 16% 1,312 15%
Africa
260
3% 205
2%
Asia
712
8% 630
7%
Total
8,909 100% 8,512 100%
2.7.1.4 Consolidated sales revenue
EFTAW*
Voluntary departures
Turnover rate
9,245
321
3.47%
* Equivalent full-time average wage.
2.7.2 Incentive schemes, profit-sharing and stock options
2.7.2.1 Employee profit-sharing
a) Profit-sharing and incentive scheme
Profit-sharing
The funds paid out in the form of special reserves for profit-
sharing during the past 3 years are as follows (in million euros):
2012
2011
2010
5.1
3.9
1.0
Incentive scheme
Most of the companies within the Group have an incentive
system allowing employees to participate actively in the
group’s performance. The methods for calculating the sums
involved depend on the criteria of each company.


